Figures & data
Fig. 1 Regional bathymetry of the south-western Barents Sea, showing the main troughs and banks (Andreassen et al. Citation2008). Also indicated are the approximate locations of the cores used in the present and previous studies. Bathymetry from the Norwegian Hydrographic Service (www.mareano.no).
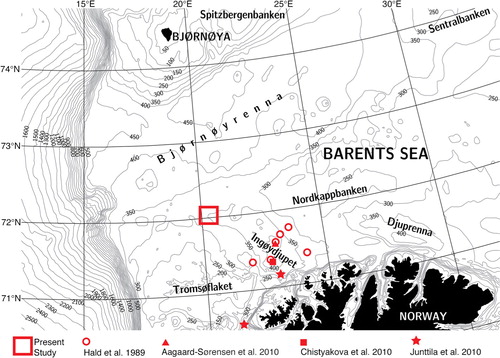
Fig. 2 Bathymetry of the study area with the coring sites. See for location in the south-western Barents Sea. Note the occurrence of several pockmarks, appearing as circular depressions (Pau et al. Citation2014). Multibeam bathymetry acquired by the Norwegian Defence Research Establishment.
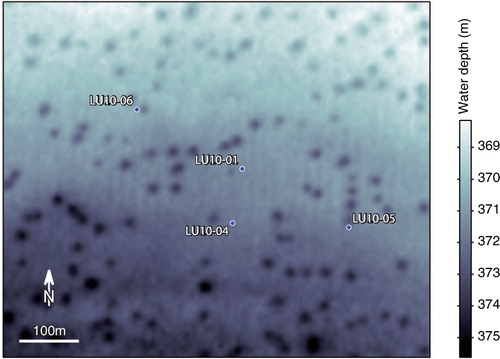
Table 1 Length, water depth and position (WGS84) of the Lundin Petroleum 2010 (LU10) cores.
Fig. 3 CT image, lithological units (dashed lines) and subunits (dotted lines), x-ray and gamma density, MS and grain size (gravel, >2000 µm; sand, 63–2000 µm) for the investigated cores. Average ages (Ky B.P.) of the dated intervals are indicated. Details of the CT images are illustrated in .
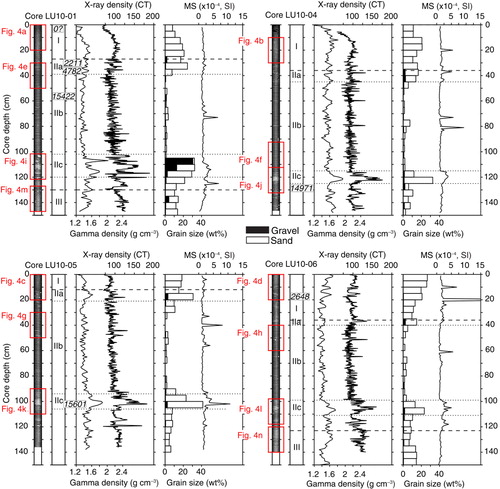
Fig. 4 Detailed views of the CT images: (a–d) Holocene marine sediments (Lithological Unit I); (e–h) glaciomarine laminated sediments (Lithological Unit II, Subunit IIb); (i–l) IRD layer (Lithological Unit II, Subunit IIc); (m) and (n) glacial till (Lithological Unit III). Columns from left to right refer to cores LU10-01, LU10-04, LU10-05 and LU10-06. The yellow line in (c) marks the contact between Lithological Unit I and the IRD layer topping Lithological Unit II (Subunit IIa), while in (e) it marks the erosion surface between Subunit IIa and the underlying laminations (Subunit IIb).
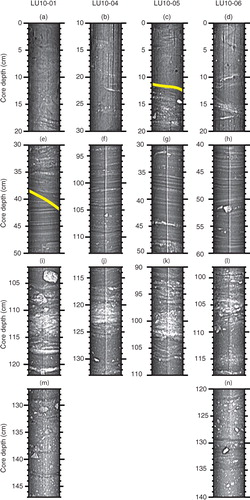
Fig. 5 Total number of foraminiferal specimens per unit weight of dry sediment (histogram) in core LU10-01. Assemblage Zones A, B and C (shades of grey), Lithological Units I, II and III (dashed lines) and Lithological Subunits IIa, IIb and IIc (dotted lines) are marked.
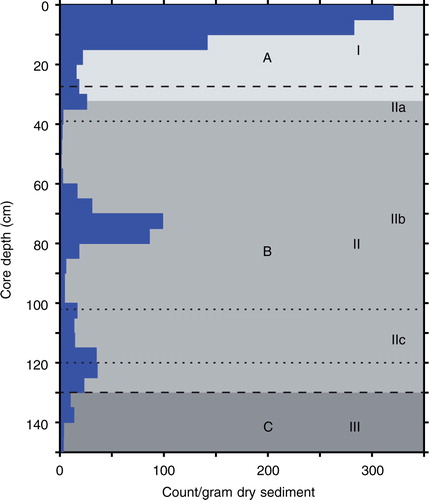
Fig. 6 Frequency distribution (%) of the main benthic foraminiferal taxa and the total planktic fauna in the >63 µm fraction in the studied cores. Assemblage Zones A, B and C (shades of grey), Lithological Units I, II and III (dashed lines) and Lithological Subunits IIa, IIb and IIc (dotted lines) are marked. Ages (Ky B.P.) are also indicated.
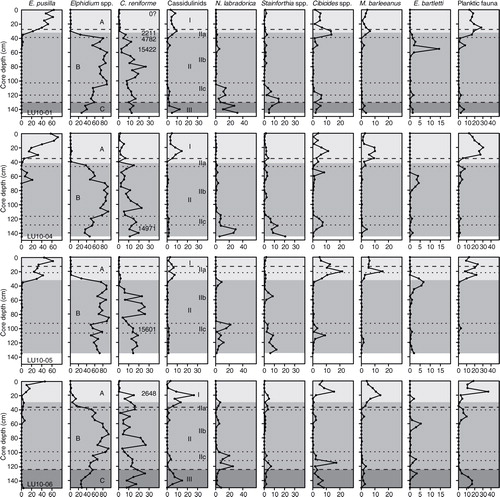
Fig. 7 Relative abundances of planktic foraminifera in core LU10-06 (percentages of the total planktic fauna). Assemblage Zones A, B and C (shades of grey), Lithological Units I, II and III (dashed lines) and Lithological Subunits IIa, IIb and IIc (dotted lines) are marked.
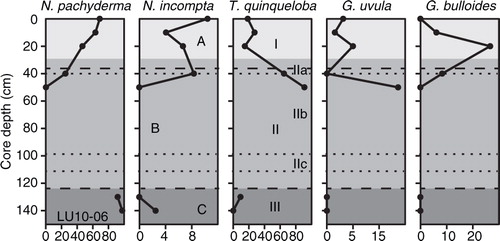
Table 2 Results from accelerator mass spectrometry 14C radiocarbon dating and calendar (cal.) year calibrations. The error in 14C age (not reservoir corrected) is given as ±1σ. The analyses were conducted at the Radiocarbon Dating Laboratory, Lund University, Sweden. The dates were calibrated into calendar years before 1950 (years B.P.) using the Marine13 calibration curve (Reimer et al. Citation2013) and are given as 95% confidence intervals. A standard reservoir correction of 400 years with an additional reservoir correction ΔR=67±41 was employed.
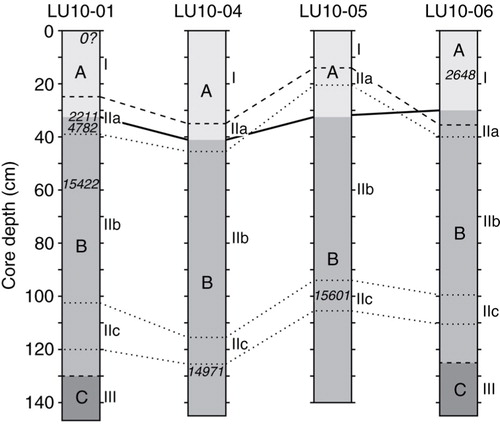
Fig. 8 Biostratigraphic correlations among the cores (solid lines). Assemblage Zones (A, B and C; shades of grey), lithological units (I, II and III; dashed lines) and subunits (IIa, IIb, and IIc; dotted lines) are marked. Ages (Ky B.P.) are also indicated.