
Figures & data
Fig. 1 Topographical map of the Zackenberg valley with contour lines at 10 m intervals showing the locations of the study sites.
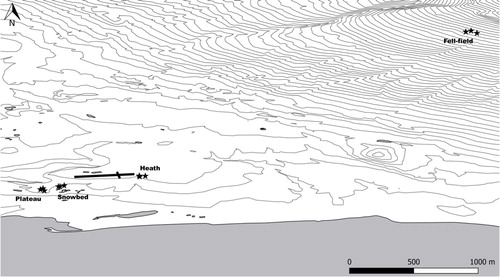
Fig. 2 Salix arctica seedlings collected in 2009 at Zackenberg and sorted by age classes: (0) newly established, (1) one year old and (2) two years old or more. Age classes correspond to those in Table 1.
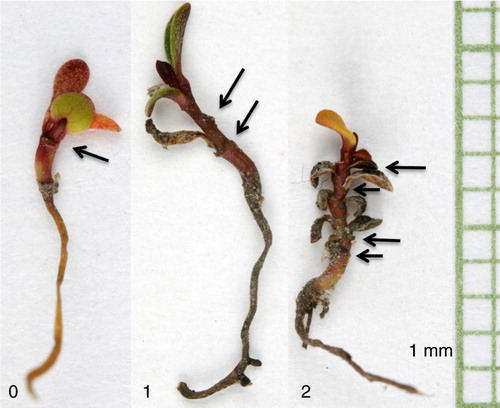
Fig. 3 Thin sections from the wood samples collected on (a) the plateau, (b) the snowbed, (c) the heath and (d) the fell-field.
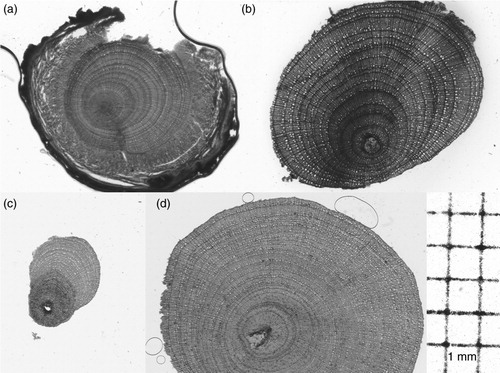
Fig. 4 Total catkin density (#/m2), seedling density (#/m2), stem radial growth (µm/year), crown area increment (cm2/year), soil moisture (% vol), soil total N and P (µg/10 cm2/burial period) and total vegetation cover in four plant communities at Zackenberg, Greenland. Different letters indicate significant differences between sites (MCTAKW, P<0.05; Tukey HSD, P<0.05). Sampling size varies per variable and plant community measured, for catkins and seedling density: P: n=3, S: n=30, H: n=30, F: n=3; stem radial growth: P: n=18, S: n=19, H: n=13, F: n=31; crown area increment: P: n=21, S: n=20, H: n=12, F: n=22; Soil N and P: P, S and H: n=7, F: n=10; soil moisture: n=28/plant community; total vegetation cover: n=3/plant community.
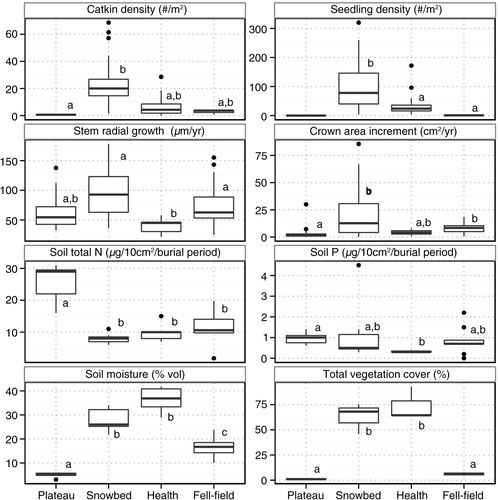
Table 1 Salix arctica seedling density (#/m2; total and per age class) and associated standard error in four plant communities at Zackenberg, north-east Greenland, in 2010. Age classes are defined in . Superscript letters indicate significant differences within a row for total seedling density (MCTAKW, P<0.05). Symbols * and † indicate significant difference in seedling density among age classes (MCTAKW, P<0.05).