
Figures & data
Fig. 1 Map showing location of experimental streams within the Kolyma River watershed in north-eastern Siberia.
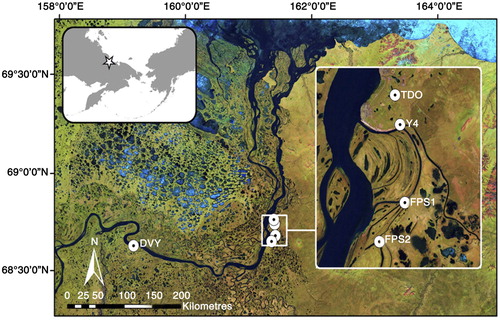
Table 1 Mean background values for relevant physical and chemical variables for the five streams used in this study.
Fig. 2 Nutrient spiralling parameters (S W , U, v f ) for (a–c) N and P and (d–f) their ratios in upland and floodplain streams. Error bars are ±1 standard error.
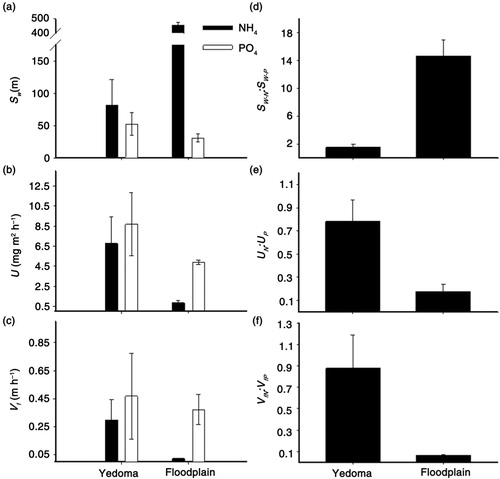
Fig. 3 Relationships between transient storage indices (A s /A and t stor ) and (a, b) discharge and (c, d) v fP . Error bars are ±1 standard error.
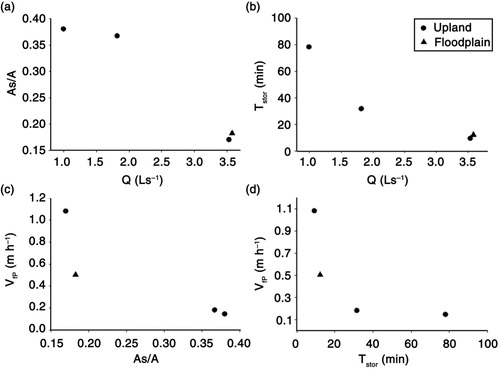
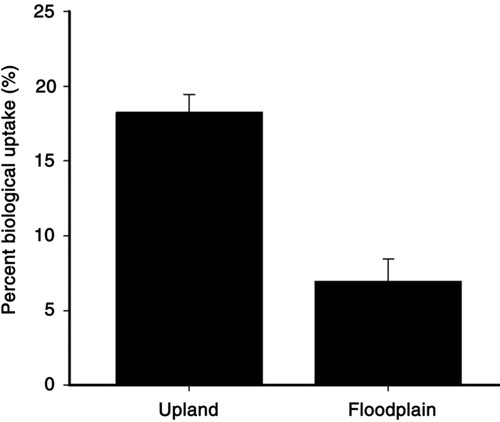
Fig. 4 Biological uptake of P by floodplain and upland sediments. Error bars are ±1 standard error.
Supplemental material