Figures & data
Fig. 1 Map of Flandres Bay, located in the western AP. Insets show the location of the AP with respect to Antarctica and the location of the study area. Seafloor bathymetry mapped using multibeam swath bathymetry data from cruises NBP0201, NBP0502, NBP0602A, NBP0703 and NBP1001 to the AP. Red circles represent core locations. Glacial drainage basins of glaciers are outlined in purple (from Cook et al. Citation2014). Briand Fjord and Etienne Fjord are abbreviated as BF and EF. Numbers show glaciers draining into Flandres Bay: 1, Vogel Glacier; 2, Bolton Glacier; 3, Sayce Glacier; 4, Goodwin Glacier; 5, Archer Glacier; 6, Talbot Glacier; 7, Niepce Glacier; 8, unnamed glacier; letters in red squares show 210Pb sedimentation rates: a, 1.71 mm/yr; b, 1.17 mm/yr; c, 2.8 mm/yr; d, 0.65 mm/yr (Isla et al. Citation2002; Isla et al. Citation2004; Boldt et al. Citation2013).
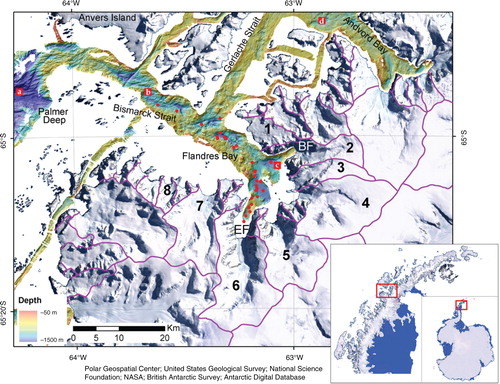
Fig. 2 Grab samples and cores collected in Flandres Bay: grab sample (GB), box core (BC), kasten core (KC), trigger core (TC), piston core (PC) and jumbo piston core (JPC). Some cores were collected in pairs (one grab sample and one piston core for example); therefore, a small circle and a large circle are in the same location. Names of each core correspond to core identification numbers in Supplementary Table S1. The profiles line A–A’ is presented in . Maroon outlines show glacier front change as measured by Cook et al. (Citation2014).
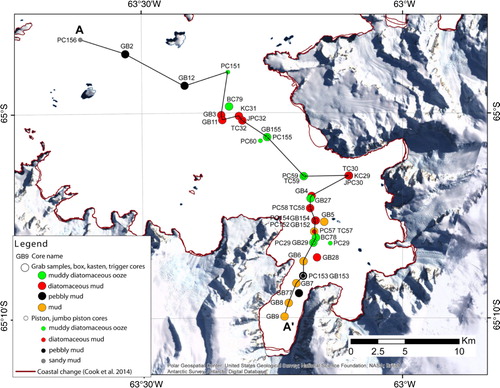
Fig. 3 Distribution maps of percent grain size along the bay: (a) clay, (b) total silt and (c) sand percentages per sample. Solid circles represent grab samples (GB), box cores (BC), kasten cores (KC) or trigger cores (TC). Open circles represent piston cores (PC) or jumbo piston cores (JPC). Sampled cores are listed in Supplementary Table S1.
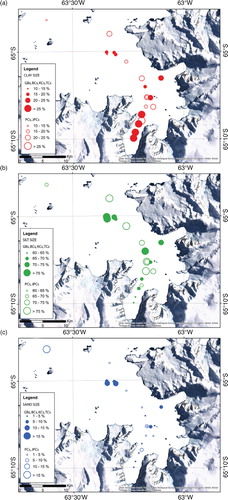
Fig. 4 Distribution maps of percent lithology along the bay: (a) clay minerals, (b) diatoms, (c) heavy minerals and (d) quartz percentages per sample. Solid circles represent grab samples (GB), box cores (BC), kasten cores (KC) or trigger cores (TC). Open circles represent piston cores (PC) or jumbo piston cores (JPC). Sampled cores are listed in Supplementary Table S1.
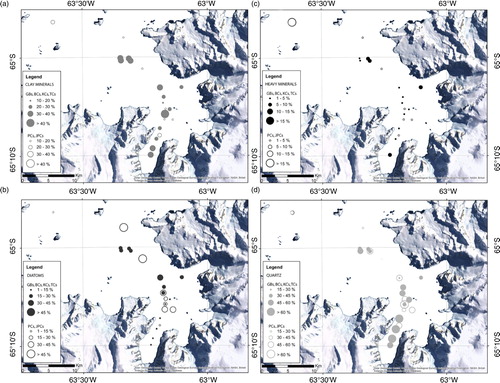
Fig. 5 Profile line A–A’ showing water depth, location in . The circles in the profile line represent sampled cores with their resulting percent lithology, percent grain size and pebbles. Name of each core is also shown. Purple circles represent grab samples (GB), box cores (BC), kasten cores (KC) or trigger cores (TC). Green circles represent piston cores (PC) or jumbo piston cores (JPC). Notice that not all sampled cores are shown in this figure, only cores in the profile line A–A’.
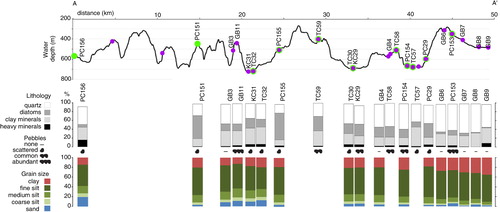
Fig. 6 Sediment distribution in Flandres Bay draped over swath bathymetric data indicating bottom roughness.
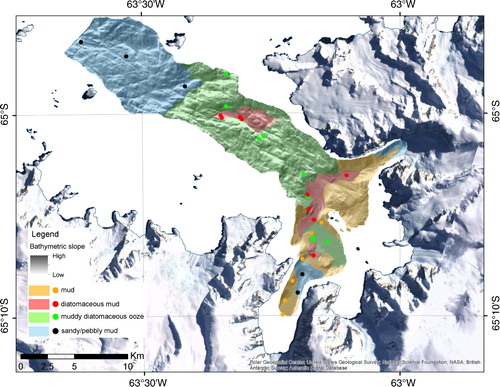
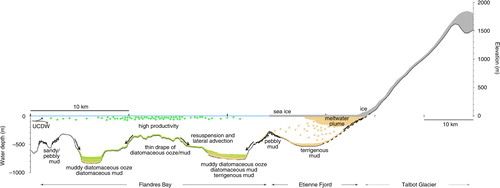
Fig. 7 Illustration representing various sediment distribution processes taking place in Etienne Fjord and Flandres Bay. Upper Circumpolar Deep Water is abbreviated to UCDW. Note different horizontal scale used in Talbot Glacier (elevation for Talbot Glacier from Cook et al. Citation2014).