Figures & data
Fig. 1 Temperatures over time at the four study sites. Symbols represent average thawing degree days totals (TDD) for the summer at a given site in a given year. The sample size was the number of years of the experiment (19 at Barrow dry, 18 at Barrow wet and 17 at both Atqasuk sites).
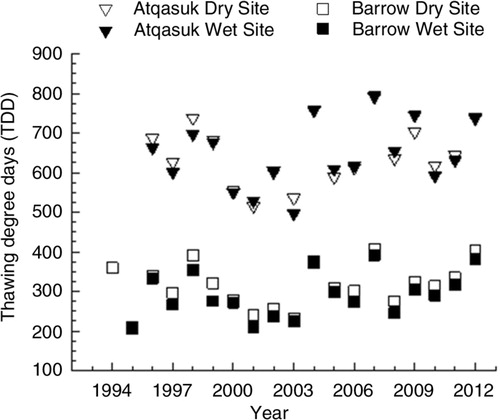
Fig. 2 Relationship between year and effect size of experimental warming on plant traits (a) inflorescence height, (b) leaf length, (c) reproductive phenology and (d) reproductive effort. Each point represents the effect size (calculated as Hedges’ d) of experimental warming on one plant trait at one study site for a given year. Equations and P values are given for significant weighted least-squares regressions (shown with solid line). For (c), reproductive phenology N=43; for other traits N=39.
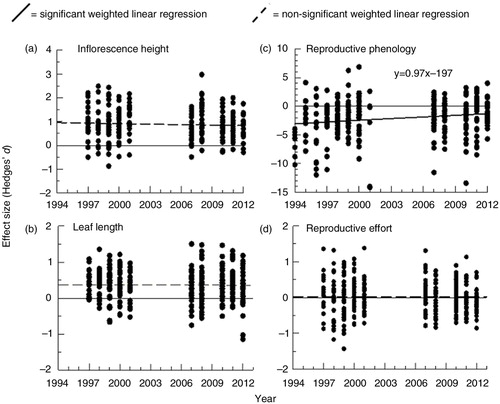
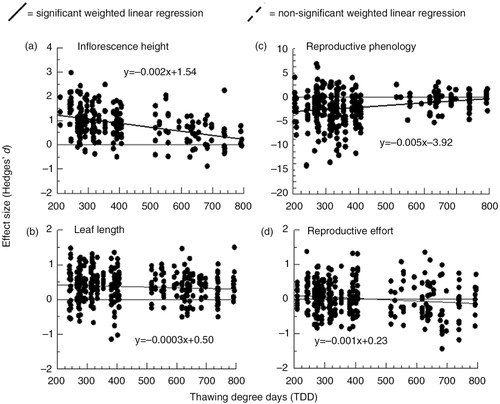
Fig. 3 Relationship between seasonal temperature (TDD) and effect size of experimental warming on plant traits (a) inflorescence height, (b) leaf length, (c) reproductive phenology and (d) reproductive effort. See .