Figures & data
Fig. 1 (a) Geological overview of the Heimefrontfjella and (b) its position in a Gondwana reconstruction (after Jacobs & Thomas Citation1994).
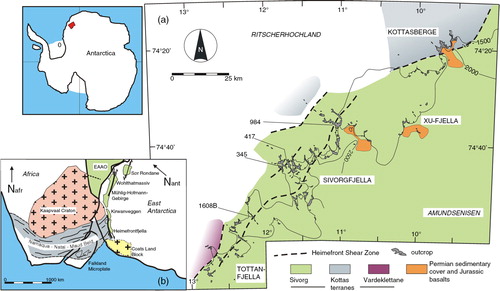
Fig. 2 Geological map of the Kottasberge with sample locations. (a) Stereographic projection of the thrust zones in the Kottas Terrane with the trajectories of the stretching lineations (Hoeppener diagram). (b) Stereographic projection of high-angle shear zones in the south-western nunataks and the trajectories of the stretching lineations. At the top of Vikenegga a quartz c-axis diagram of sample KB15, 157 axes, contours at 1, 2, 3, … %.
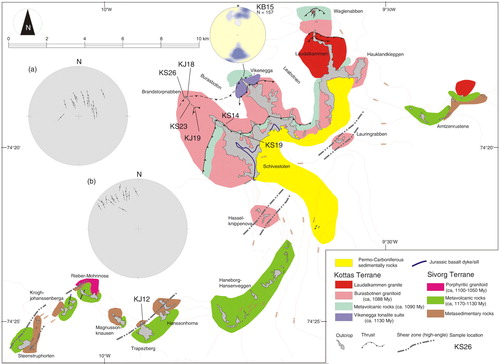
Fig. 3 Examples of shear zones and thrusts in the Kottasberge (a) steep shear zone in bimodal metavolcanic rocks at Trapezberg, sampling site of KJ12, view in north-eastern direction; (b) ductile thrust zone at Brandstorpnabben, view in south-western direction, the hanging wall moved to the right; (c) ductile thrust zone at Vikenegga, view in south-western direction, the hanging wall moved to the right.
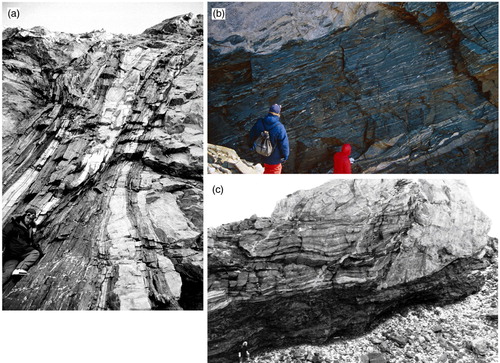
Table 1 Common glide systems in quartz (Nicolas & Poirier Citation1976; Law et al. Citation1990).
Fig. 4 Pole diagrams showing quartz c-axes/quartz (001) reflection patterns produced by (a) pure shear (Flinn diagram) and (b) simple shear (Schmid & Casey Citation1986) with the prism a poles in orange; (c) positions different types of quartz c-axis maxima, modified from Sander (Citation1950).
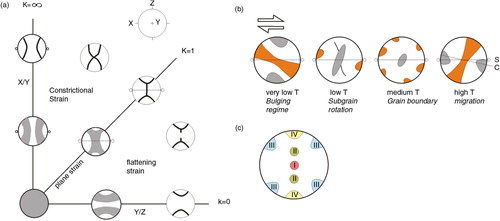
Fig. 5 Pole diagrams and quartz c-axis diagrams of mylonites from the HSZ. Quartz LPOs (x-ray texture goniometry) of prism a, recalculated from measured pole figures. Base (001) calculated from ODF. Contours at 1.0, 1.2, 1.4 … times uniform distribution. Quartz c-axis presented in an equal area projection, lower hemisphere, contours 1, 2, 3… %. All diagrams are shown in the XZ cut of the finite strain ellipsoid with Z at the top and X in horizontal direction.
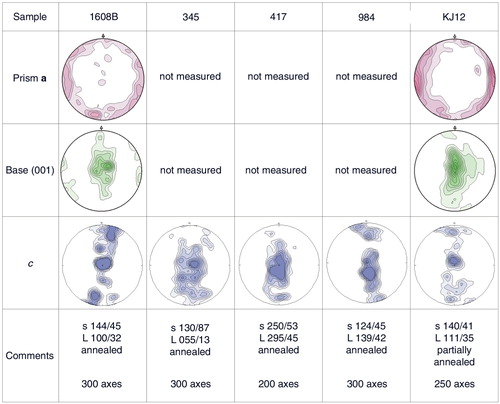
Fig. 6 Pole diagrams and quartz c-axis diagrams of mylonites from ductile thrusts in the Kottasberge. Quartz LPOs (x-ray texture goniometry) of prism a, recalculated from measured pole figures. Base (001) calculated from ODF. Contours at 1.0, 1.2, 1.4 … times uniform distribution. Quartz c-axis presented in an equal area projection, lower hemisphere, contours 1, 2, 3 … %. All diagrams are shown in the XZ cut of the finite strain ellipsoid with Z at the top and X in horizontal direction.
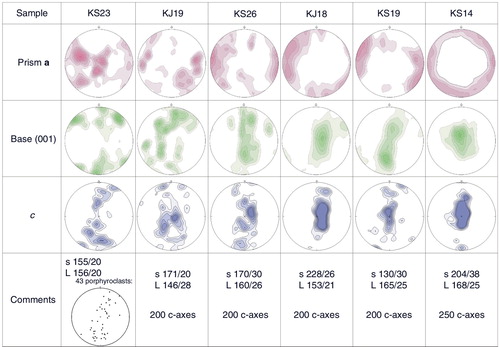
Fig. 7 Microphotographs in the XZ plane of the finite strain ellipsoid, crossed polars: (a) orthoquartzite 1608B from the HSZ, grains annealed (width of the field of view 1.84 mm); (b) protomylonitic augen gneiss from Leabotnen showing elongated quartz crystals with numerous subgrain boundaries and beginning recrystallization along the grain margins (width of field of view 1.3 mm, polarizer and analyser both rotated by ca. 45°); (c) protomylonitic augen gneiss KS23, Brandstorpnabben, quartz with core and mantle structure (width of field of view 3.2 mm); (d) orthomylonite KS19 from Buråsbotnen with ribbon quartz (width of field of view 1.3 mm); (e) ultramylonite KJ18, centre of the Brandstorpnabben thrust, polygonal recrystallized grains with few larger porphyroclasts (width of field of view 0.46 mm); (f) ultramylonite KS14, centre of the Buråsbotnen thrust, polygonal pattern of recrystallized grains (width of field of view 0.46 mm).
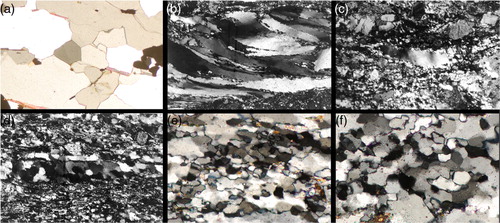
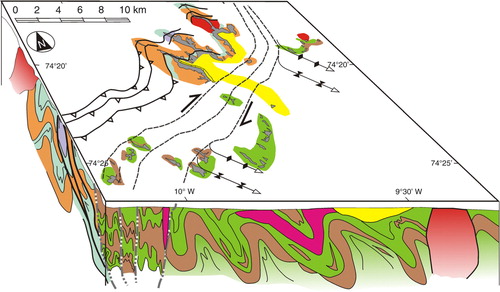
Fig. 8 Block diagram showing the Kottas Terrane as the north-west foreland of the transpressive HSZ. The arrow indicates the current Antarctic north.