Figures & data
Fig. 1 (a) Location of Dome Argus, East Antarctica. The locations of Dome Fuji, Dome B, Vostok, Dome C and South Pole are also shown. (b) Sketch map of sites for GPS and stake measurements. The base map was generated using QGIS 2.6 (http://www.qgis.com/). Contour line intervals are 500 m.
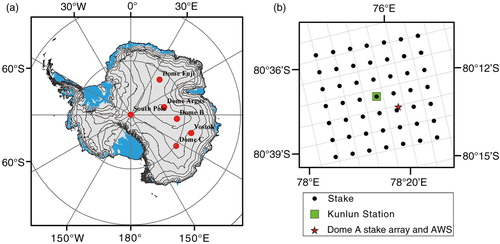
Fig. 2 The coefficient of variation (σ) of SMB, SHC and density when the stake quantity is increased at (a) the DA and (b) DZ array; and the coefficient of variation (δ) of σ of (c) DA and (d) DZ. The shaded area indicates recommended minimal number of stakes needed to obtain reliable estimates of SMB at for (a, c) local and (b, d) regional spatial scales.
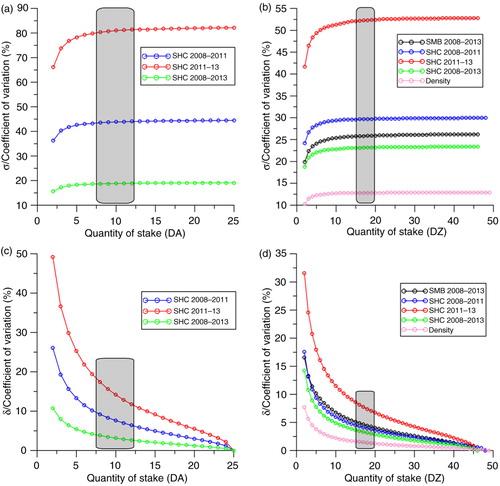
Fig. 3 (a) Map of the mean (2008–2013) SMB across Dome Argus interpolated from stake observations. Black contours are surface elevations (WGS84 ellipsoid) with intervals of 2 m based on GPS data from 27th CHINARE. The small and large white dashed squares cover the 64 km2 and 400 km2 areas surveyed by Zhang et al. (Citation2007) and Cheng et al. (Citation2009), respectively. The solid white square represents Kunlun Station, the red star represents DA stake array and the red triangles represent the two summits of Dome Argus. (b) Map of surface density interpolated from observations.
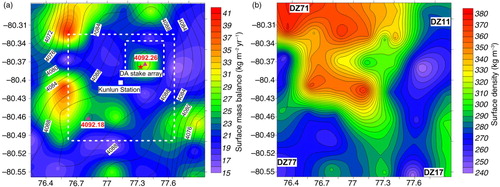
Table 1 Compilation of SMB (kg m2 yr−1) estimates for Dome Argus.
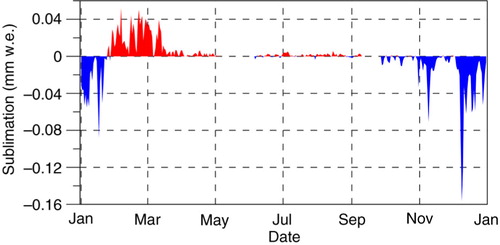
Fig. 4 Five-year (2005–2010) averages of estimated daily mean sublimation (blue) and deposition (negative sublimation, red) at Dome Argus.