
Figures & data
Fig. 1 Tectonic sketch map of (a) northern Victoria Land (redrawn from Carmignani et al. Citation1989). (b) Map of the permanent tilt network on Mount Melbourne.
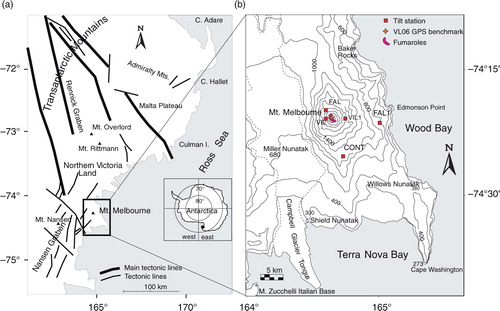
Fig. 2 Scheme of a borehole tiltmeter.
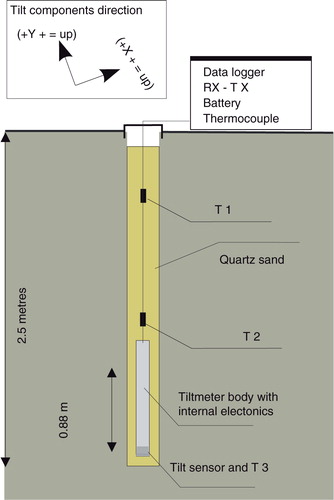
Fig. 3 Example of daily cycle recorded at the four temperature sensors of the CONT station in January 1991 (redrawn from Gambino Citation2005).
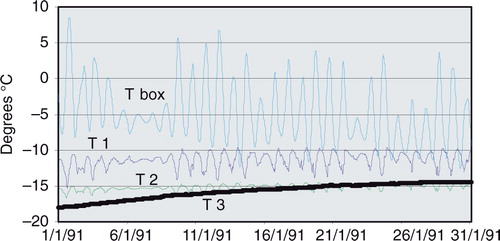
Fig. 4 Air and permafrost temperatures historical series recorded at the FAL1 station. Data have been filtered by applying a moving average of 96 samples, to remove the summer daily frequency, and successively re-sampled for each day.
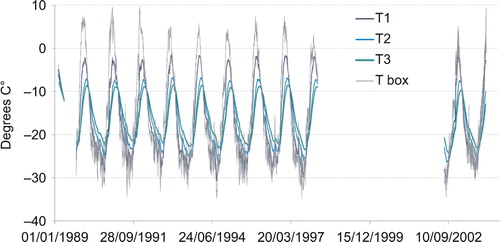
Fig. 5 Radial tilt component at the five stations. Data filtered to remove the high frequency noise by applying a moving average of 96 samples (two days). Numbers define the three phases discussed in detail in the text.
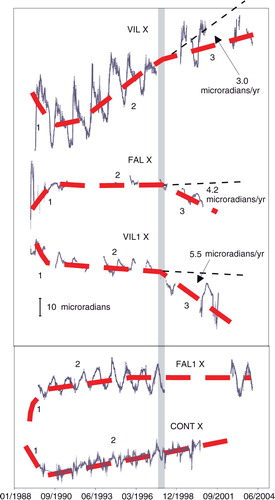
Fig. 6 Tangential tilt component at the five stations. Data filtered to remove the high frequency noise by applying a moving average of 96 samples (two days). Numbers define the three phases discussed in detail in the text.
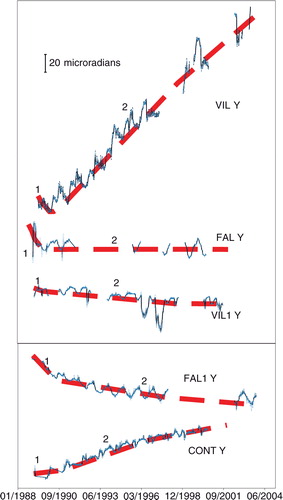
Fig. 7 Location and east–west cross-section of the pressure source modelled. The vertical error is reported on the cross section.
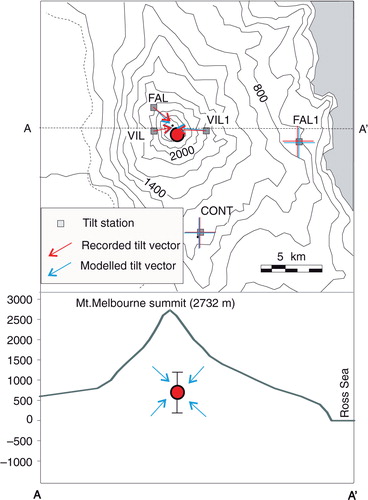
Table 1 Best fitting range for the model.