
Figures & data
Fig. 1 The location of Milthers’ glaciers and the meteorological station in Tasiilaq. Source: map 65Ø 1 and 2 (original scale 1:250.000) by the Danish Institute of Geodesy, mapped 1932–33, revised in 1945 and 1969. Contour intervals 50 m. (Reproduced with permission of Kort & Matrikelstyrelsen, G 15-99.)
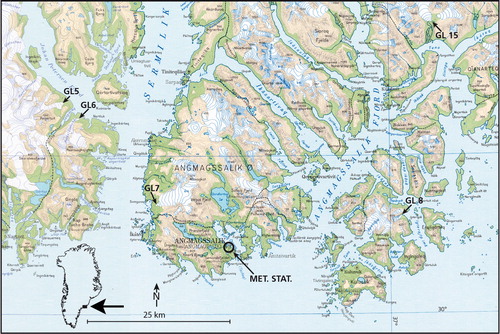
Fig. 2 Summer (June, July, August) average temperatures (thin line) and 10-year running mean (thick line) in Tasiilaq (Cappelen Citation2014). The dots indicate the average temperatures during this study's observational periods in 1933, 1996–99 and 2000–2010. Horizontal grey lines indicate the time span, vertical ones the standard deviations.
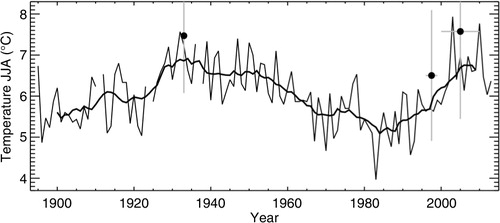
Fig. 3 Mittivakkat Glacier (7). (a) Sketch and (b) photograph from 1933 (Milthers Citation1933), and (c) photograph from 2010 (N. Jacup Korsgaard), all taken from the same location near the coastline. The terminus was at 7 m a.s.l. in 1933 (); with the surrounding valley walls being about 200 m high, stakes are estimated to have been at 20–50 m above the terminus elevation.
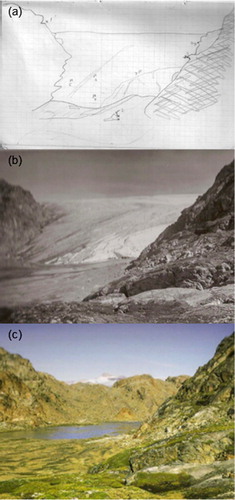
Table 1 UTM coordinates (zone 24W) and altitudes of the glacier termini in 1933 and 2010, including the terminus retreat over the period. The coordinates and altitudes represent the lowest position of each glacier. Glacier 8 values are unknown.
Fig. 4 ARs (a) and DDFs (b) calculated from ablation measurements in 1933 (dots) and recent years (circles) (Supplementary Table S1). Horizontal grey lines represent the corresponding periods. Grey dots illustrate minimum-value measurements.
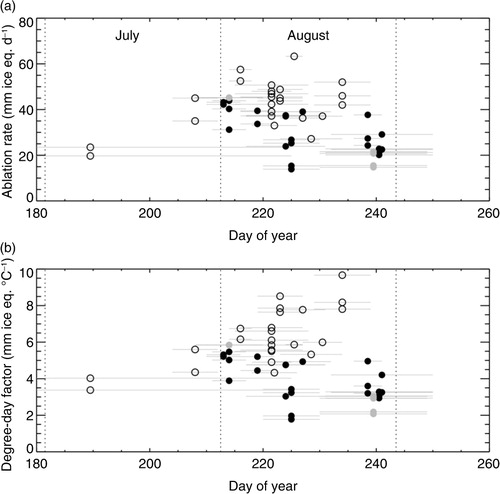
Table 2 UTM coordinates (zone 24W) and altitude ranges of recent stakes on glacier 7 for 2008. The horizontal variation due to the annual redrilling of the stakes is within 50 m.