Figures & data
Table 1 The mean, ±SD, median and data range of POP concentrations (ng/g wet weight (wt)) in feathers, livers and preen glands of adult kittiwakes from Ny-Ålesund, Svalbard. Compounds detected below the LOD in more than 60% of the samples are reported as not detected (nd).
Fig. 1 Concentration of sum 19 PCBs in female and male kittiwake tissues. Feather (ng/g wet weight [wt]), liver and preen gland (ng/g lipid wt) from the incubation period (1) and the chick-rearing period (2).
![Fig. 1 Concentration of sum 19 PCBs in female and male kittiwake tissues. Feather (ng/g wet weight [wt]), liver and preen gland (ng/g lipid wt) from the incubation period (1) and the chick-rearing period (2).](/cms/asset/d72d933f-0759-4e4d-96d3-805880e263e8/zpor_a_11821478_f0001_ob.jpg)
Fig. 2 The POP profiles of feathers, preen glands and livers from kittiwakes. The 95% confidence intervals are indicated with error bars.
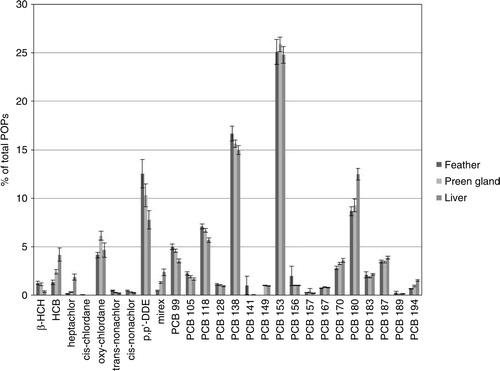
Fig. 3 Indirect ordination analysis from a PCA presenting the POPs (β-HCH, HCB, heptachlor, Σchlordanes, p,p′-DDE and ΣPCBs) profile in kittiwake feathers, livers and preen glands. The arrows point in the direction of increasing mean contribution of POP load. Percent variability explained by the two first principal components (PC1 and PC2) is given.
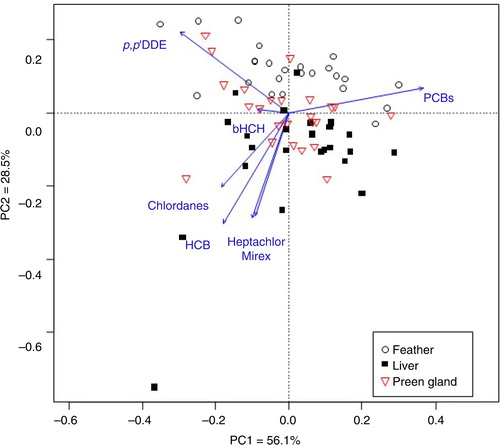
Fig. 4 Box-and-whisker plot of lipid content in kittiwake livers and preen glands during incubation and chick-rearing periods.
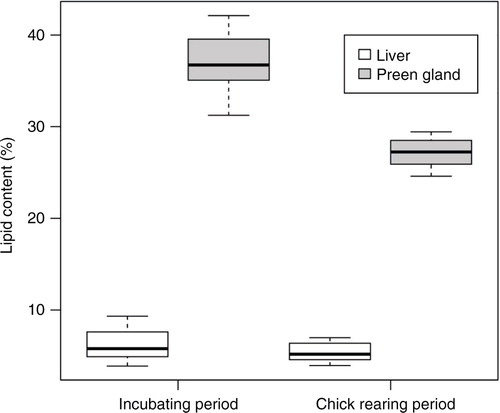
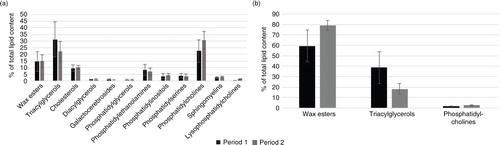
Fig. 5 The mean contribution from each lipid class in the kittiwakes’ (a) liver and (b) preen gland as a percent of total lipid content, in the incubation (1) and chick-rearing period (2). The standard deviations are indicated with error bars.