Figures & data
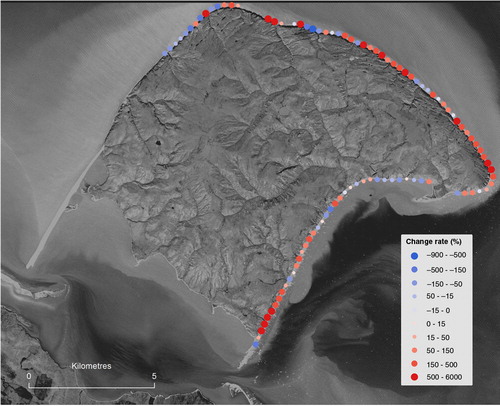
Fig. 1 Hypsometric tint and bathymetry map of Herschel Island in the Canadian Arctic with place names. Coastal areas are marked with the year of the LiDAR DEM acquisition used for calculations. Displayed are also four coastal units (east, north and west coast and Workboat Passage).
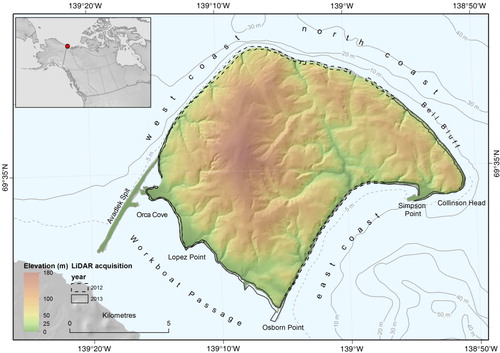
Fig. 2 Map of planimetric erosion inside belt transects on Herschel Island. Net rates of coastline movement in 2000–2011 were calculated from digitized coastlines.
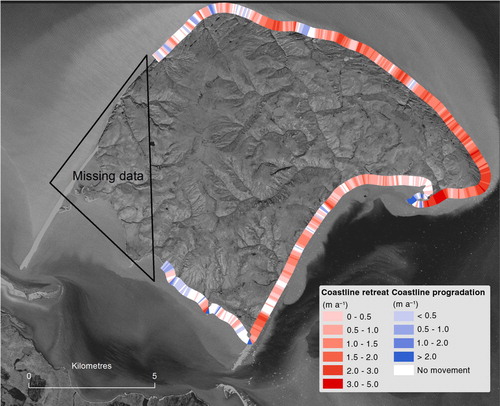
Table 1 Coastline movement, volume decrease, sediment release and carbon and nitrogen fluxes in different coastal units. Volume decrease and sediment release rates include interpolated data for gap filling.
Fig. 3 Map of volumetric erosion inside belt transects on Herschel Island. Net sediment release rates in 2000–2011 are based on DEM elevation changes.
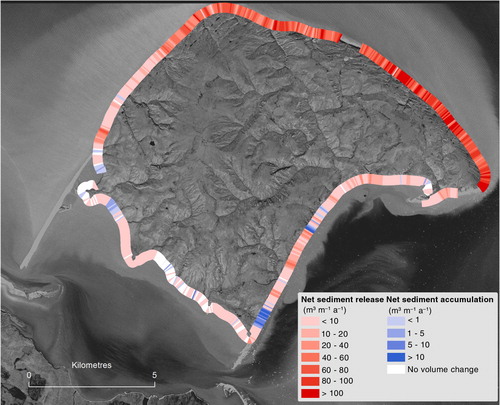
Fig. 4 Scatterplot with linear best fit showing sediment release rates based on DEM elevation change compared to sediment release calculated from coastline retreat and cliff height.
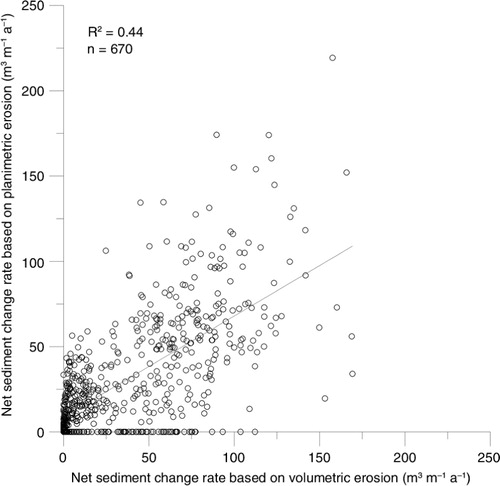
Fig. 5 Coasts of Herschel Island can undergo a series of mass wasting and accumulation processes. Material is transported as mudflows, landslides and block failures before reaching the shore. (a) Slumping, mudflows and shore accumulations on Bell Bluff; (b) active-layer detachment on the east coast (marked with a white dashed line); (c) block failure on the north coast; and (d) retrogressive thaw slump on the east coast.
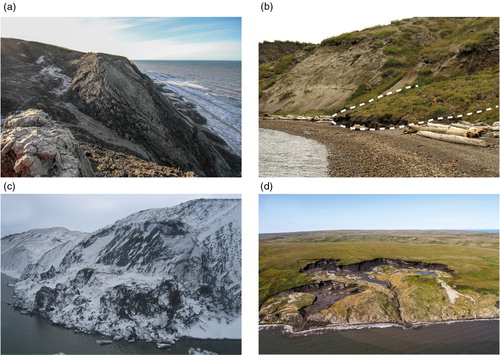
Fig. 6 Rate of change in coastline movement between 1970–2000 and 2000–2011. Coastline movement rates for 1970–2000 were estimated by Lantuit & Pollard (Citation2008).