
Figures & data
Fig. 1 Circumpolar distribution map of all known breeding sites (triangles) of the AFS (Arctocephalus gazella). Filled triangles indicate the study sites mentioned in . Baseline mapping data are from Scambos et al. (Citation2007) and bathymetric data are from Amante & Eakins (Citation2009).
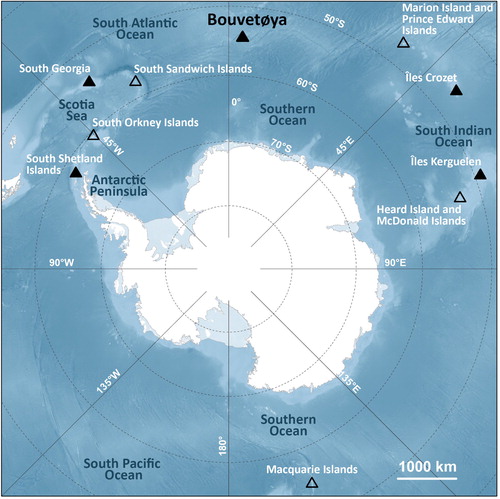
Table 1 Sample sizes for tissues, by collection year, from female AFS (Arctocephalus gazella) during the breeding season at Bouvetøya (54°23′S 3°47′E).
Fig. 2 Interannual variation in isotopic ratios in whole blood (N1997=41 and N2015=36) of female AFS (Arctocephalus gazella) from Bouvetøya. Isotopic biplots show the interannual variation in mean (± SD, empty symbols and error bars) carbon (δ 13C) and nitrogen (δ 15N) isotopic ratios for 1997 (orange) and 2015 (black). The estimated 40% (inner, representing the core niche region) and 95% (outer, representing the global niche region) random ellipses are also shown for each year. Ten thousand random ellipses were generated for each year and each Nr threshold, but for clarity only the first 1000 are shown in this figure. Density curves for each isotope and each year are also drawn marginally along the corresponding axis. Discrimination factors were applied to δ 13C and δ 15N values.
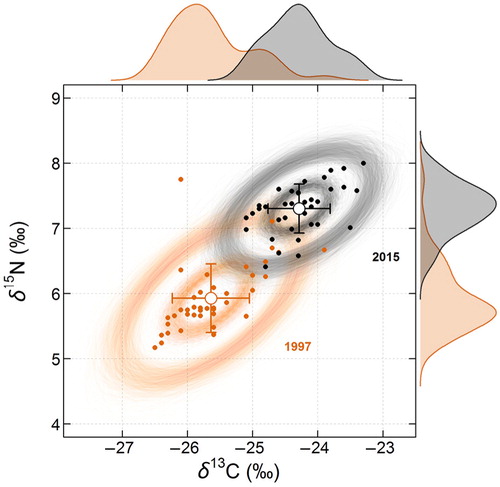
Fig. 3 Shift in isotopic niche region areas between 1997 and 2015 for (a) the 95% (global niche region) and (b) 40% (core niche region) thresholds, based on carbon and nitrogen isotopic ratios of female AFS (Arctocephalus gazella) from Bouvetøya. Sample size is 1000 for each group, based on the random elliptical projections of Nr that were generated from this study (see methods for details; Swanson et al. Citation2015).
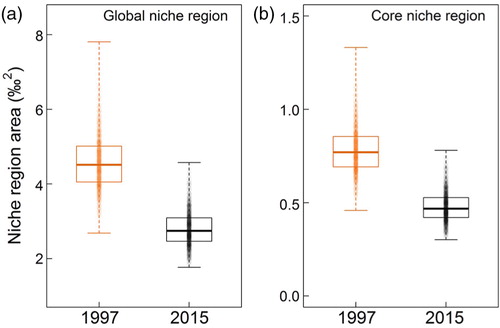
Table 2 Interannual variation in isotopic ratios. Comparison of linear models explaining the shift in isotopic ratios (δ 13C and δ 15N) in whole blood of female AFS (Arctocephalus gazella) from Bouvetøya, between 1997 (intercept level) and 2015 (see ). Boldface indicates P values significant at the 0.05 statistical level.
Fig. 4 (a) Nitrogen (δ 15N) and (b) carbon (δ 13C) isotopic ratios in plasma (N=96) of female AFS (Arctocephalus gazella) from Bouvetøya displayed across the timing of the breeding season using cross-sectional sampling in three years. The black lines and grey-shaded areas show the mean and standard error predicted from a simple linear model on the data pooled over three years (Y ~ Julian day). The orange lines and shaded areas show the same information but from a linear model where year is included as a covariate (Y ~ Julian day + Year). Discrimination factors were applied to δ 13C and δ 15N values (see methods for details).
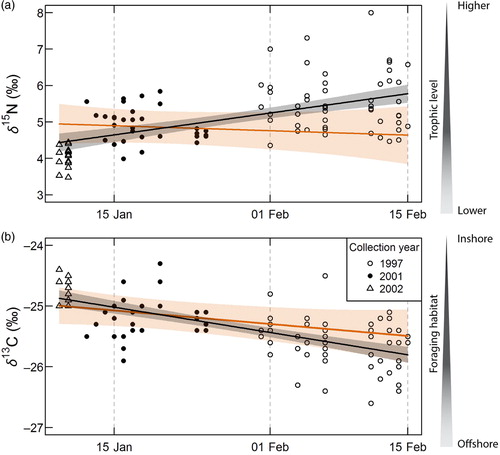
Table 3 Intra-seasonal variation in isotopic ratios. Comparison of linear models predicting δ 13C and δ 15N in plasma of female AFS (Arctocephalus gazella) from Bouvetøya. For each response variable, two models are compared, one with and one without an effect of sampling year (see ). Boldface indicates P values significant at the 0.05 statistical level.
Table 4 Comparative summary of the results from isotopic studies on AFS (Arctocephalus gazella), including the present study. Temporal trends in isotopic values for carbon and nitrogen are indicated, along with a plausible interpretation when a positive (↑) or negative (↓) trend was detected. See for a map of the study sites.