Figures & data
Fig. 1 Simplified tectonic sketch of the southern Spitsbergen, modified from Dallmann (Citation1992) and Bergh & Grogan (Citation2003). Annotated and framed areas denote localities described in the text. Abbreviations: AB, Adriabukta; EHF, Eastern Hornsund Fault; IHF, Inner Hornsund Fault; LS, Liddalen syncline; LD, Liddalen; LF, Liddalen Fault; MF, Meranfjellet; SS, Samarinbreen Syncline; TR, Treskelodden.
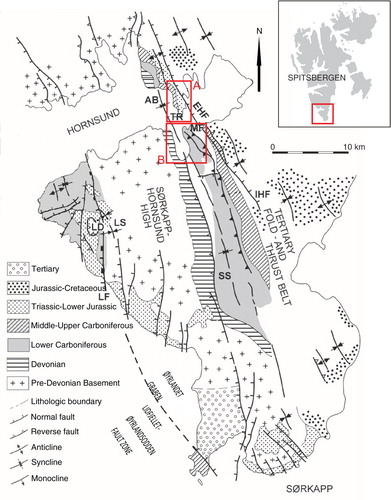
Fig. 2 Locations of sampling sites (map modified from Birkenmajer Citation1990; Ohta & Dallmann Citation1994).
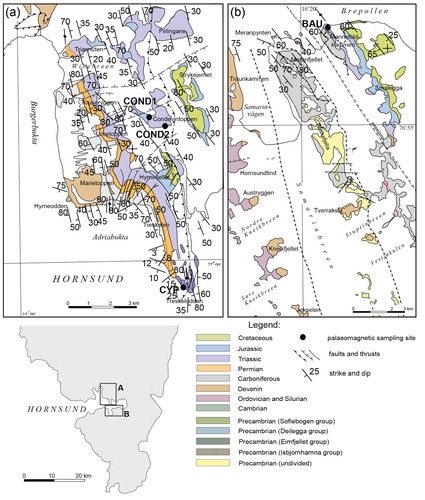
Fig. 3 Results of thermal demagnetization of a composite three-axis IRM (Lowrie Citation1990). Applied fields: 0.12T (black curve); 0.4 T (red curve) and 3T (green curve) for (a) CYP03 and (b) CON06.
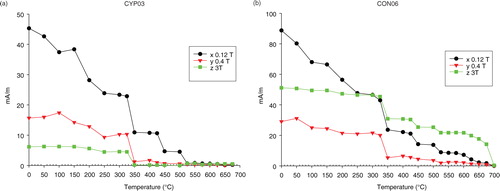
Fig. 4 Results of stepwise acquisition of IRM for (a) BAU and (b) COND 1.
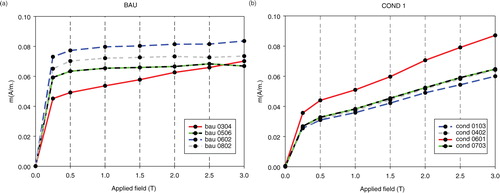
Fig. 5 Magnetic susceptibility versus temperature curves. Typical diagram characteristic for sites BAU, CYP and COND2 with (a) heating (red) and cooling (blue) curves and (b) with only heating thermomagnetic curves. Example of diagram from site COND1 with (c) both curves and (d) with only the warming curve.
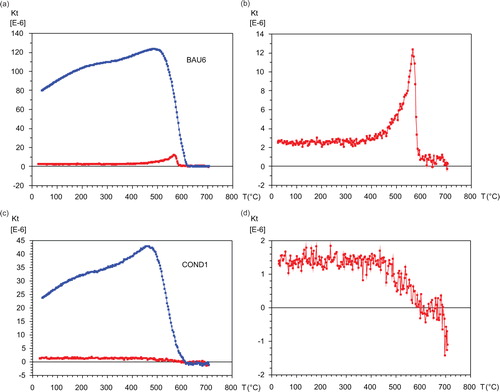
Fig. 6 Example of hysteresis loops where (a) the paramagnetic fraction is dominant and (b) the ferromagnetic fraction is dominant. Numbers 1 (large graphs) and 2 (small graphs) indicate loops before and after paramagnetic correction, respectively.
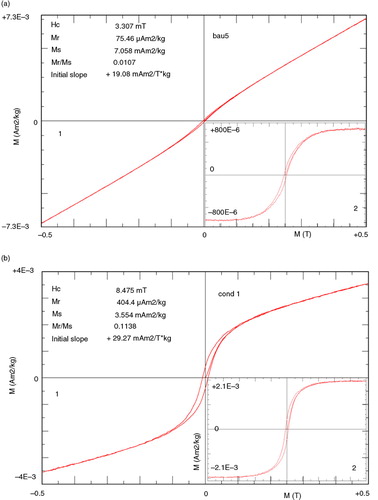
Table 1 Selected hysteresis parameters of investigated samples. The ferro-/paramagnetic minerals ratio was evaluated on the basis of the initial slope values before and after correction for paramagnetic minerals.
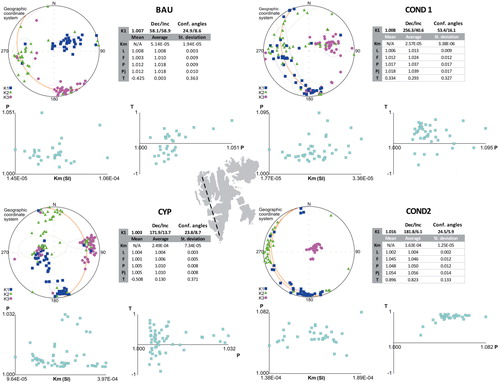
Fig. 7 The AMS results at the investigated sampling sites. Stereographic diagrams show results before the tectonic correction. Abbreviations: K1, maximum axis; K2, intermediate axis; K3 minimum axis; orange line, bedding plane; Km mean magnetic susceptibility; L, magnetic lineation; F, magnetic foliation; Pj, Jelinek's degree of anisotropy; T, shape parameter; P, anisotropy degree. The dashed line in the map of Svalbard indicates the orientation of the WSFTB.