Figures & data
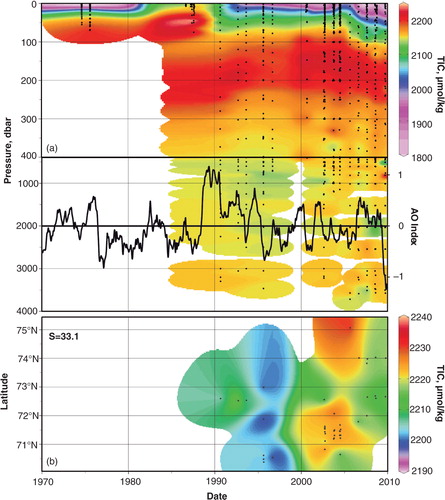
Fig. 6 (a) Vertical total inorganic carbon (TIC) distributions in the Beaufort Sea and Canada Basin (within red box on Fig. 1a) through time overlaid with the Arctic Oscillation (AO) index, defined as the difference in sea-level atmospheric pressure anomalies of opposite sign between the Arctic and 37–45°N (data from the US National Oceanic and Atmospheric Administration Climate Prediction Center). (b) TIC on the 33.1 salinity surface, corresponding to the Pacific Water core and defined as salinities between 32.9 and 33.3. Note the different TIC colour scales between (a) and (b).