Figures & data
Table 1 Demographic characteristics of sample (N =52)
Table 2 Trait measures
Fig. 1 (a) Stimulus-locked ERP waveforms (amplitudes in µV, time in ms) plotted at CPz to each unpleasant (red line), pleasant–nonsexual (blue line), pleasant–sexual (IAPS only, green line), pleasant–sexual (erotic images only, green dashed line), and neutral (black line). For illustration, the two types of pleasant–sexual stimuli are each plotted though they are averaged together for statistical comparisons. (b) Topographical difference (color heads) and statistical (black and white heads) head maps are presented. Difference and statistical head maps are plotted for each simple-effect between experimental conditions for the P300 component window.
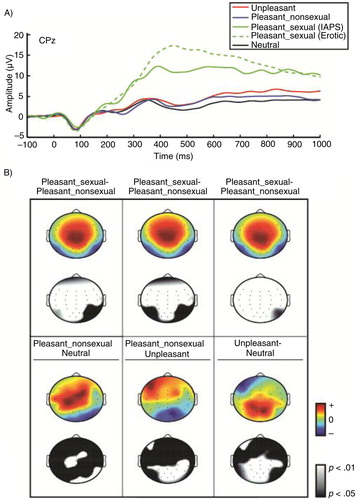
Fig. 2 An ERP difference score, plotted at CPz, between pleasant–sexual and neutral stimuli plotted against the measure of sexual desire (dyadic).
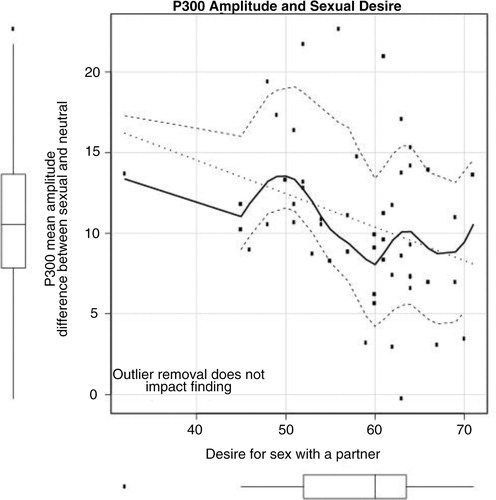
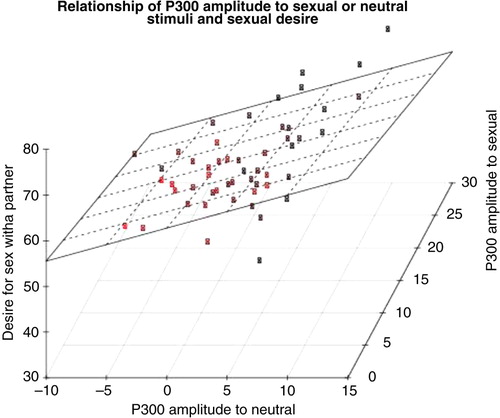
Fig. 3 A scatter plot depicting the relationship between P300 amplitude to neutral stimuli, P300 amplitude to pleasant–sexual stimuli, and the measure of sexual desire (dyadic).