Figures & data
Fig. 1 A brain MRI on the 10th day after disease onset: various sized patches of slightly long T1 and slightly long T2 signal intensities scattered across the bilateral parietal gray–white matter junction zones, the subcortical white matter, and the semi-oval center and left cerebellum. Some of these lesions had clear boundaries, and others indicated brain swelling; most of the lesions exhibited small patchy enhancements following the intravenous injection of Gd-DPTA.
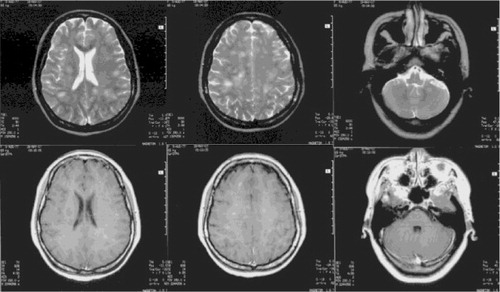
Fig. 2 In the 5th week after disease onset, repeated brain MRIs: the original lesion had become more clear, the brain swelling had disappeared, most of the lesions exhibited no enhancement, and individual lesions with mild small patchy enhancements remained present but with significantly reduced signal intensities.
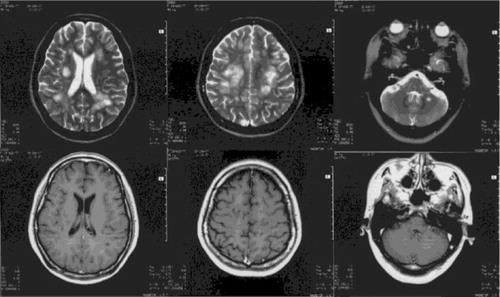
Fig. 3 Brain MRIs 1 year after the disease: the lesion number was similar to that originally observed, but the signal intensities of the lesions had significantly decreased, the boundaries were clear, and lesions exhibited no enhancement.
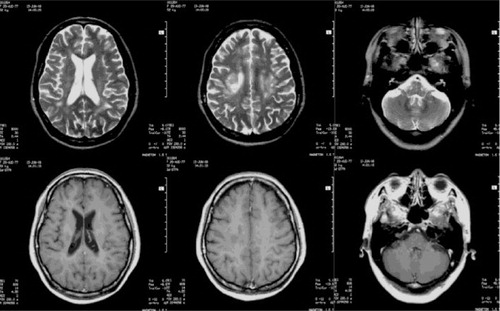
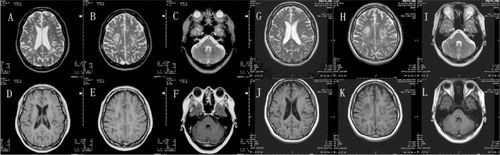
Fig. 4 Two repeated brain MRIs revealed no new changes. A, B, C, D, E and F were scanned in September 2010. G, H, I, J, K and L were scanned in December 2013.