
Figures & data
Table 1 Detailed description of the seven episodes to which the infants were exposed, according to partner and context
Fig. 1 Video Analyser interface. In the present study, circle-shaped markers were positioned frame by frame on the child's nose and tip of the left toe. Graphs illustrated changes in the position of these landmarks during an 8-s sequence (5 Hz) in the middle of the interaction episode.
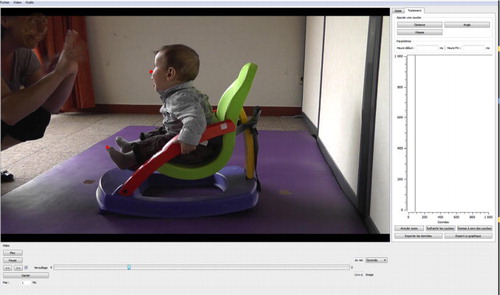
Fig. 2 Mean values and standard deviations for the infants’ overall activity according to context and partner. The thick black line indicates the baseline value when the infants were left alone in the room.
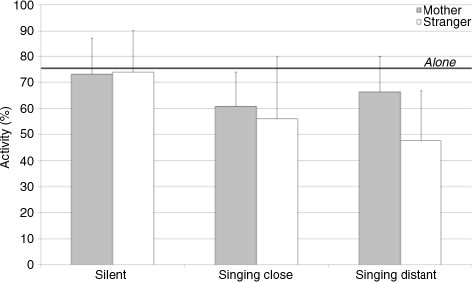
Fig. 3 Mean values and standard deviations for the mean velocity (left) and utilization distribution (right) of the nose marker in the sagittal plane according to context and partner. The thick black line indicates the baseline value when the infants were left alone in the room.
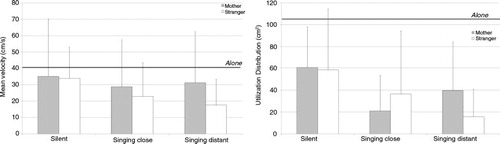
Fig. 4 Mean values and standard deviations for the mean velocity (left) and utilization distribution (right) of the toe marker in the sagittal plane according to context and partner. The thick black line indicates the baseline value when the infants were left alone in the room.
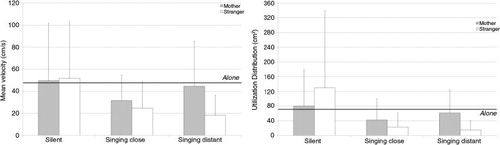
Table 2 Mean correlation coefficient (standard deviation) according to context and partner
Table 3 Partial eta-squared statistics for each variable and each comparison