Figures & data
Fig. 1. Topography of Southern Norway with the area of main interest and the locations of the nine automatic weather stations. Gullfaks C is located some 80 km to the west of the indicated position. ‘ECMWF’ indicates the position from which the ECWMF reanalysis data are obtained.
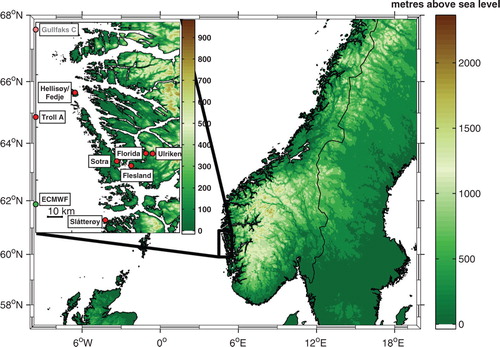
Table 1. Automatic weather stations
Fig. 2. Climatology of large-scale winds (ERA Interim 850 hPa at 60°N 4.5°E) for (a) all year, (b) the winter (December–January–February), (c) the spring (March–April–May), (d) the summer (January–July–August) and (e) the autumn (September–October–November).
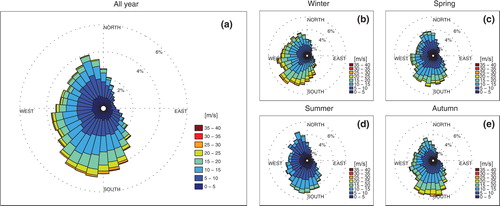
Fig. 3. Distribution of wind direction, d (°), at the chosen surface stations and ERA Interim data in Table 1 for all local wind speeds. Wind direction data from Gullfaks C are missing.
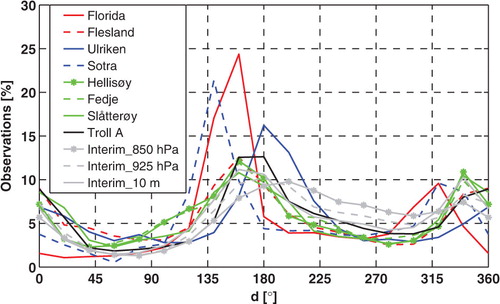
Fig. 4. Same as in Fig. 3 but for local wind speeds above 10 m s–1. The thick, horizontal line at 25% corresponds to a change of scale in the y-axis. The change in scale is done to make the results below the line directly comparable to the results in Fig. 3.
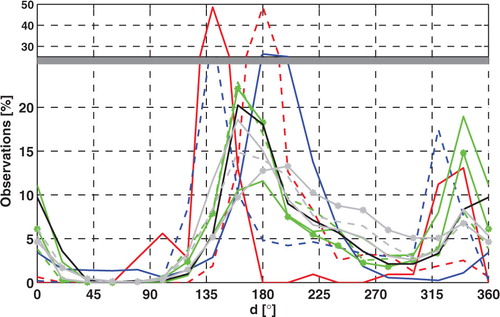
Fig. 5. Fitted Weibull distributions of wind speeds, f (m s–1), for the chosen surface stations and the ERA Interim data. The inserted panel (upper right corner) shows the upper tails of the distributions (wind speeds above 20 m s–1) in more detail.
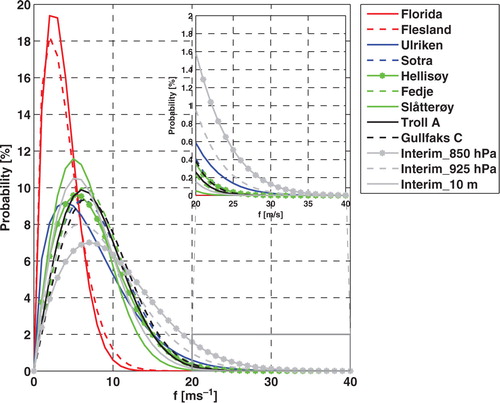
Table 2. Weibull shape and scale factors for the wind speed distribution at each station. The factor estimations are based on 6 hourly data from the respective data periods stated in Table 1
Fig. 6. Fitted cumulative Weibull distributions of wind speeds, f (m s–1), for the chosen surface stations and the ERA Interim data. The inserted panel (at the right) shows the cumulative distributions for wind speeds above 20 m s–1 in detail.
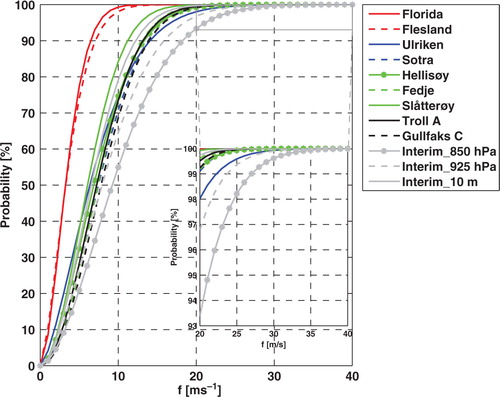
Fig. 7. Seasonal and diurnal variation in wind speed, f (m s–1), for the chosen surface stations and the ERA Interim data.
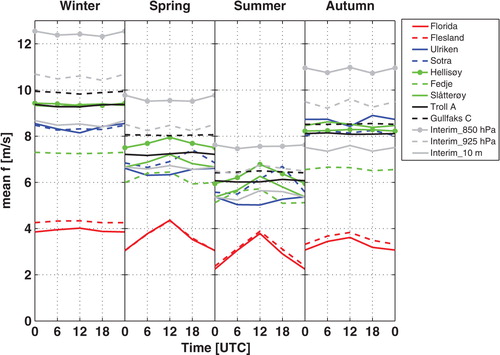
Fig. 8. Wind ratios for the surface stations and ERA Interim data as a function of the 850 hPa wind direction, d (°) for wind speeds at 850 hPa greater than 5 m s–1.
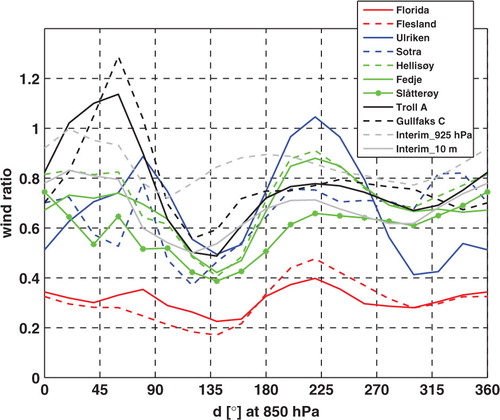
Fig. 9. Wind ratios for cases with (a) low Nh/U and (b) high Nh/U and (c) the difference between both (a) and (b) (see the text for the definition of low and high Nh/U).
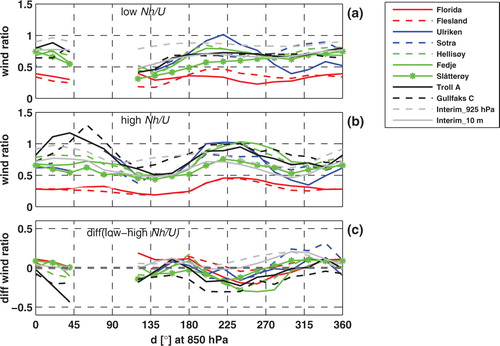
Fig. 10. Wind ratios for cases with large-scale wind speeds from (a) 5 to 10 m s–1 (b) 10 to 15 m s–1 and (c) the difference between both (a) and (b).
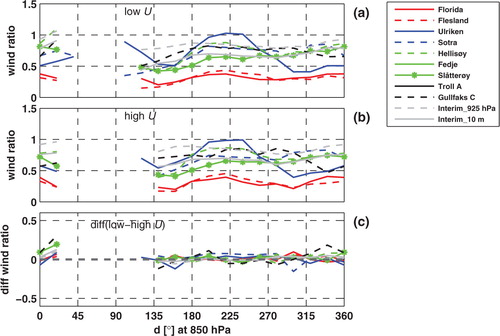
Fig. 11. Wind ratios for cases with large-scale wind speeds from (a) 5 to 10 m s–1 (b) 10 to 15 m s–1 and (c) the difference between both (a) and (b).

Fig. 12. Mean wind directions at the ground as a function of the 850 hPa wind direction.
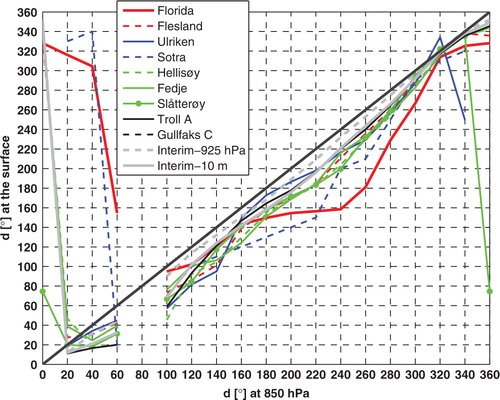
Fig. 13. (a) Map over the central Bergen area with Florida in the northeast (i) and Flesland in the southwest (ii). The city centre of Bergen is marked by a red, dashed line. Both stations are shown with circles surrounding them with radii of 4 km. Each circle sector spans 20°. (b) The sectors’ maximum topography heights are plotted as a function of direction in relation to the respective stations. The topography curve for Florida is given labels from A to D indicating the geographical locations of the dominating topographic features around that location. Ulriken is marked by a ‘B’.
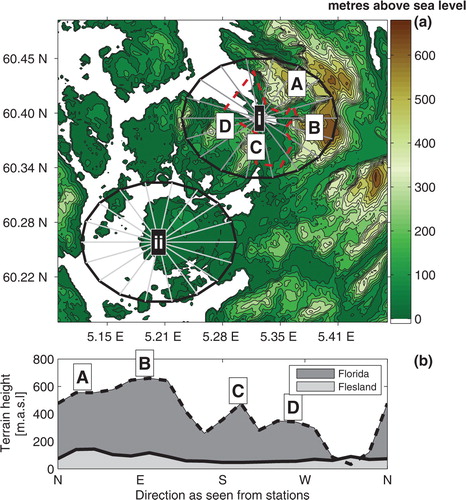
Fig. 14. Mean difference in wind speed between Florida and Flesland (Flesland–Florida) as a function of the 850 hPa wind speed, f (m s–1), and wind direction, d (°).
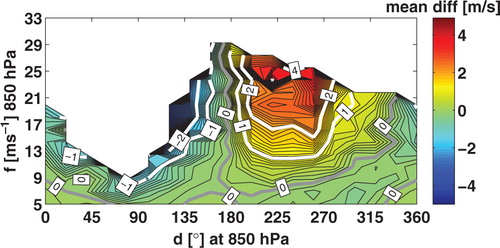
Fig. 15. Diurnal variation in wind direction distribution at Florida (green) and Flesland (red) during the summer months June, July and August for (a) all 850 hPa wind speeds (f), (b) 850 hPa wind speeds below 10 m s−1 and (c) 850 hPa wind speeds above 10 m s–1. The statistics are based on hourly 10 minutes. Averages from the years 2005 to 2009.
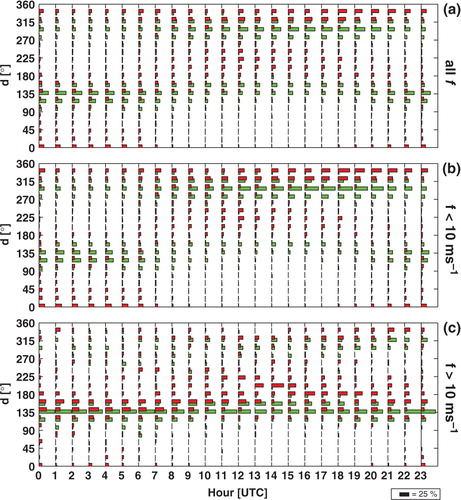
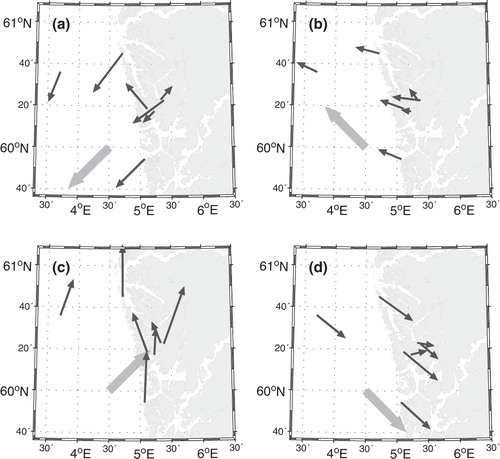
Fig. 16. Mean wind direction and wind ratio at the surface stations (black arrows) as a function of four ERA Interim 850 hPa wind directions (thick, grey arrow): (a) northeast (35–55°), (b) southeast (125–145°), (c) southwest (215–235°) and (d) northwest (305–325°). The wind ratio is indicated by the arrow lengths. For a wind ratio of 1, the black arrow has a length equal to that of the thick, grey arrow, meaning that the wind speed is the same at the surface as at 850 hPa. All 850 hPa wind speeds are above 5 m s−1.