Figures & data
Fig. 1. Area and depth datasets at 1.9°× 2.5: (a) interpolated Global Lake and Wetland Database (GLWD) lake percent (2.3 million km2) (Lehner and Döll, Citation2004); (b) default CLM4 lake percent (0.72 million km2) (Cogley, Citation1991); (c) additional lake percent in GLWD compared to default CLM4; (d) potential future lake percent compared to GLWD (net 0.14 million km2 decrease); and (e) interpolated lake depth based on Kourzeneva (2009, 2010).
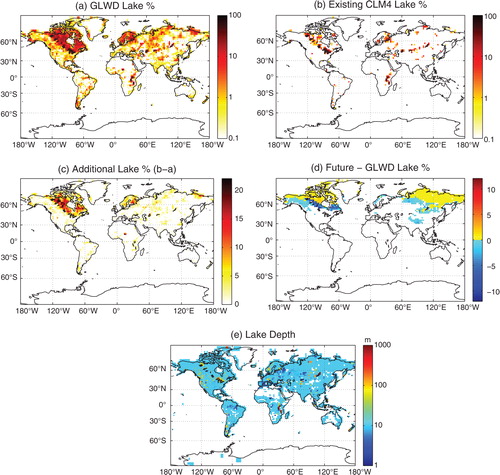
Table 1. Community Climate System Model 4 (CCSM4) experimental design
Fig. 2. Hi (GLWD lake area)–Lo (default CLM4 lake area) offline monthly average surface flux anomalies for Canada (land north of 48°N and between 175° and 325°E) under present climate: latent heat flux, sensible heat flux, rate of increase in subsurface enthalpy, upwelling longwave radiation and absorbed shortwave radiation. GLWD, Global Lake and Wetland Database.
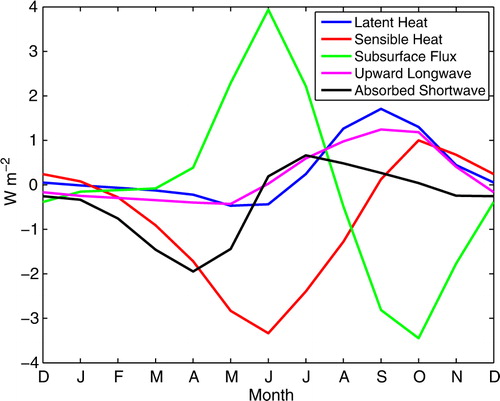
Fig. 3. Hi (GLWD lake area)–Lo (default CLM4 lake area) coupled seasonal average 2 m temperature anomalies under year 2000 conditions: (a) MAM daily maximum; (b) JJA daily maximum; (c) JJA daily minimum; and (d) SON daily minimum. Green contours encircle grid cells experiencing statistically significant changes. GLWD, Global Lake and Wetland Database.
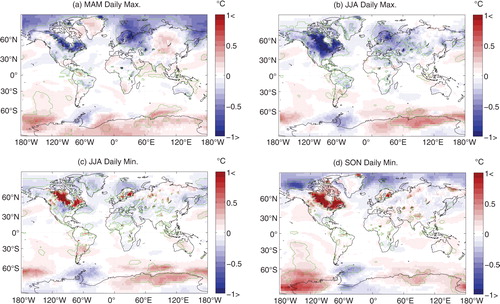
Fig. 4. Significant JJA average atmospheric temperature anomalies at 850 hPa in coupled simulations under year 2000 conditions for (a) Hi (GLWD lake area)–Lo (default CLM4 lake area); and (b) Hi (GLWD lake area)–No (no lake area). GLWD, Global Lake and Wetland Database.
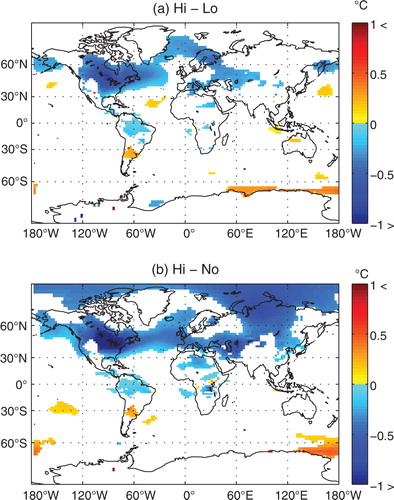
Fig. 5. Fu (potential future lake area)–Hi (GLWD lake area) coupled seasonal average 2 m temperature anomalies under doubled CO2 conditions: (a) MAM daily maximum; (b) JJA daily maximum; (c) JJA daily minimum; and (d) SON daily minimum. Green contours encircle grid cells experiencing statistically significant changes. GLWD, Global Lake and Wetland Database.
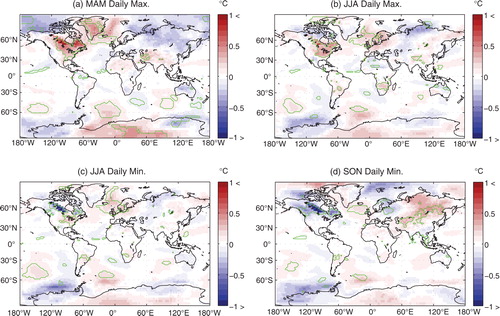
Fig. 6. JJA diurnal 2 m temperature range: coupled anomalies for (a) Hi–Lo (significant only); (b) Hi–CRU; (c) Lo–CRU; (d) CCSM4-2000–CRU; and (e) CCSM4-Historical (1980–1999 mean)–CRU; and absolute JJA 2 m diurnal temperature range for (f) CRU (1980–2002). CCSM4, Community Climate System Model 4.
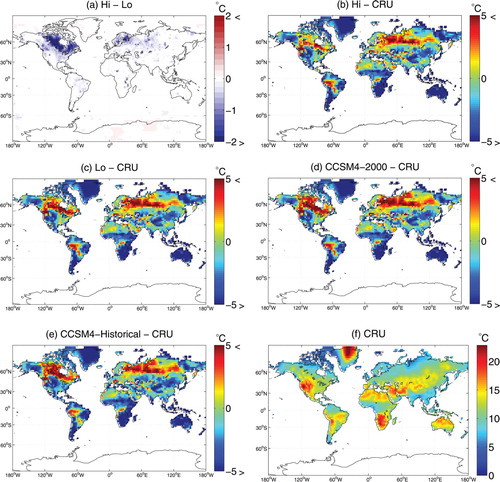
Fig. 7. Zonally averaged fields for the three aqua-planet simulations: (a) prescribed SST for control, SST + 2 and SST–2; (b) precipitation anomalies with respect to control; (c) 850 mb zonal wind speed anomalies with respect to control; and (d) 500 mb geopotential height anomalies with respect to control.
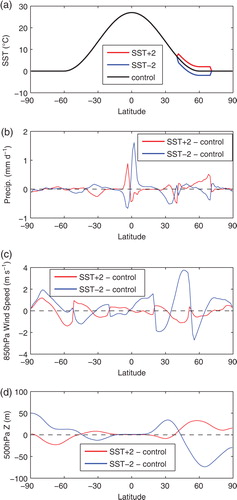
Fig. 8. Significant seasonal average atmospheric zonal mean wind anomalies (+ to the east) in coupled simulations under year 2000 conditions for Hi (GLWD lake area)–Lo (default CLM4 lake area): (a) JJA, zonal mean; (b) SON, zonal mean; (c) SON, 850 hPa; and (d) SON, 200 hPa. GLWD, Global Lake and Wetland Database.
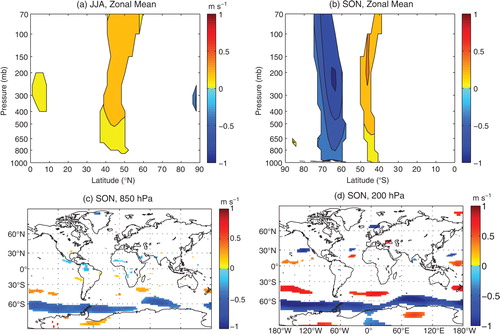
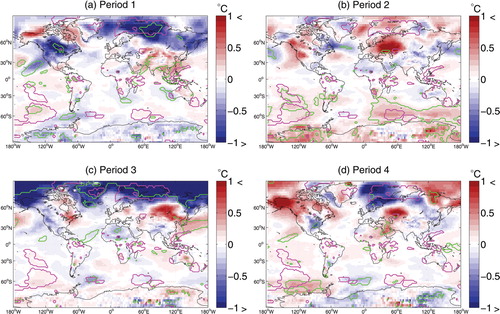
Fig. 9. Hi (GLWD lake area)–Lo (default CLM4 lake area) coupled DJF 2 m temperature anomalies under year 2000 conditions for the four 45-yr periods composing the full 180 analysed years of simulation: (a) Period 1; (b) Period 2; (c) Period 3; and (d) Period 4. Green contours encircle significant changes evaluated for each 45-yr period, whereas magenta contours encircle regions where significant changes were found for the full 180 yr. GLWD, Global Lake and Wetland Database.