Figures & data
Fig. 1. Shoreline in Lake Saimaa region in southern Finland given by different raster maps: (a) GLCC, (b) GLWD, (c) ECOCLIMAP (v. 1), (d) ECOCLIMAP (v. 2). Dark blue colour is lake water, yellow colour is land. The resolution (the pixel size) of all maps is 30 arc sec.
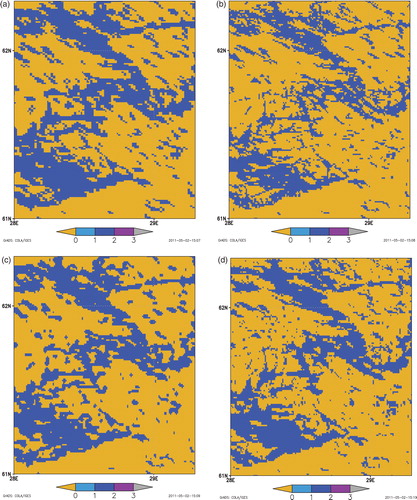
Fig. 2. Numbering of rings around the central pixel (i, j) marked by cross.
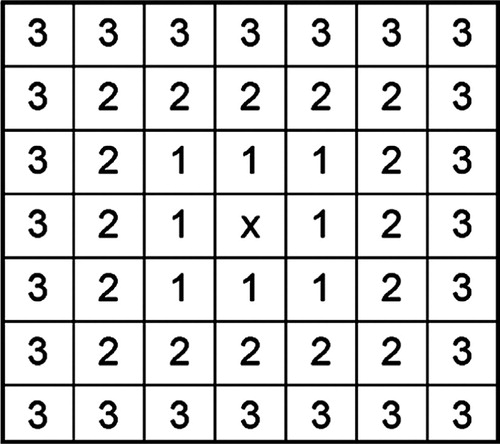
Fig. 3. Modelled field of probabilities for mapping of lakes. Grey crosses represent lake pixels of a raster map. In this example, there are two ‘spot-lakes’ on the raster map, L 1 and L 2 . The pixel, corresponding to the coordinates of any point on the surface of lake H from the dataset for individual lakes, is marked by red cross. Lines of equal probabilities P h and P b are in red and in blue, respectively (see texts for explanation of symbols). P are total probabilities obtained as maximum from the field of product of P h and P b . Lake H then gains the correspondences with ‘spot-lakes’ L 1 and L 2 with the probabilities P 1 and P 2 , respectively.
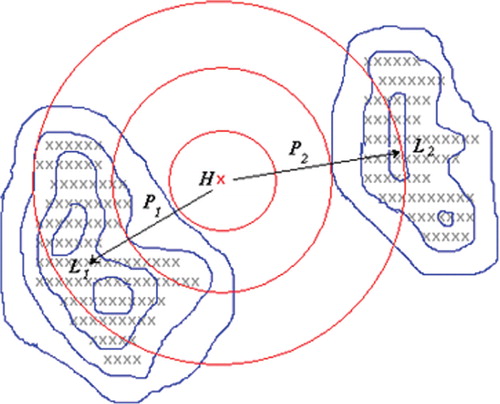
Fig. 4. The fragment from the gridded lake depth dataset with 30 arc sec. resolution: the lake depth, m for the territory around lakes Vanern and Vattern in Sweden.
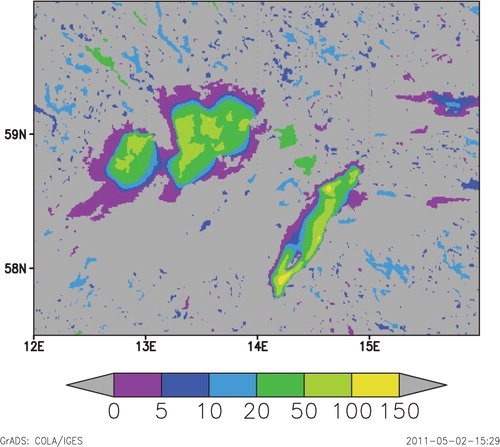
Table 1. Legend for the coded information about the origin of the lake depth data
Fig. 5. (a) Lake fraction, 0–1, and (b) the mean lake depth, m for the atmospheric model grid with 0.1 ° resolution in rotated spherical coordinates, the coordinates of rotated South Pole are (30 °, −30 °). The domain covers the area around Baltic Sea and includes Lake Ladoga, Lake Onega, Lake Vanern, Lake Vattern, Rybinskoe Reservoir and Lake Peipsi.
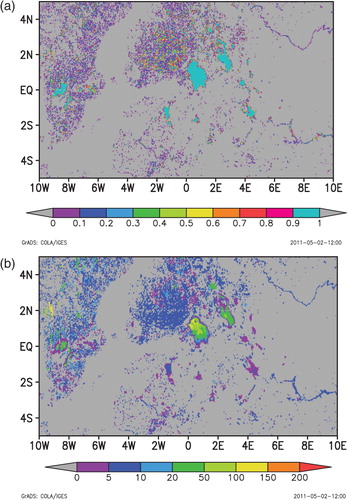
Fig. 6. The gridded code number of the origin of information (see Table 1 for a legend) for (a) Poland, (b) Karelia (c) Alaska.
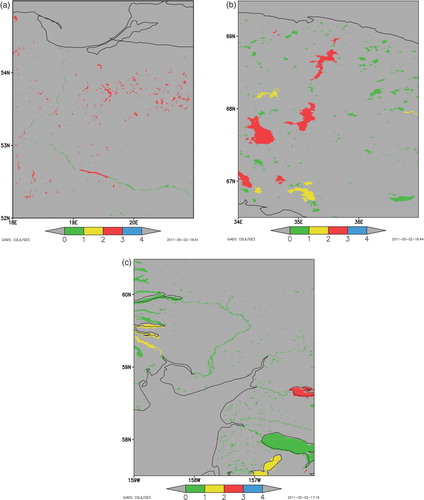
Fig. 7. Lake Tuz in Turkey, (a) as represented by ECOCLIMAP2, and (b) from remote sensing image. Dark blue colour is lake water, yellow is land.
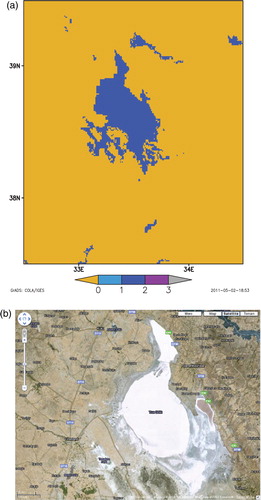
Fig. 8. Middle of the Amazon River as represented by ECOCLIMAP2 (a) and GLWD (b). Dark blue colour is lake water, magenta is river water and yellow is land.
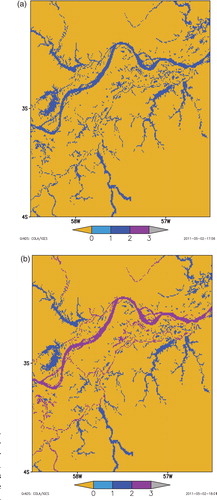
Fig. 9. The estuary of the Amazon River as represented by ECOCLIMAP2. Dark blue colour is lake water, blue is sea water and yellow is land.
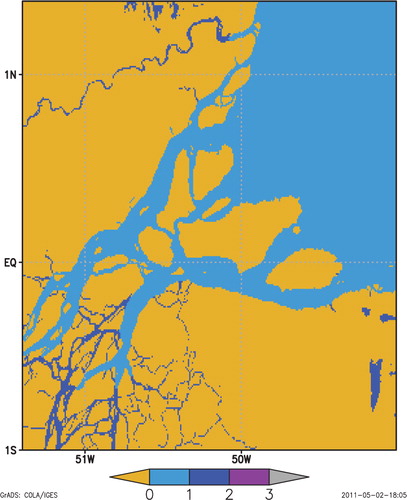
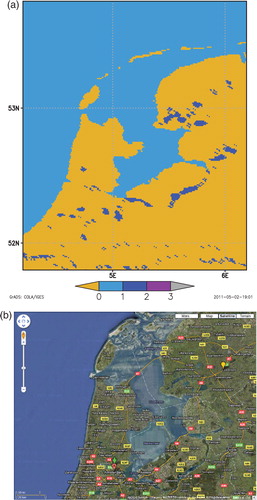
Fig. 10. Lake Ijsselmeer and Lake Markermeer in the Netherlands as represented by ECOCLIMAP2 (a) and from the remote sensing image (b). Dark blue colour is lake water, blue is sea water and yellow is land.