Figures & data
Fig. 1. Simulated climate bottom temperature for the beginning of July for imitative lakes with 50 m depth (see text for details). Above: without a relaxation of the bottom temperature for the long-term mean screen level air temperature (note unrealistic 4 °C values for large territories in Africa, South America and Australia), below: with the said relaxation.
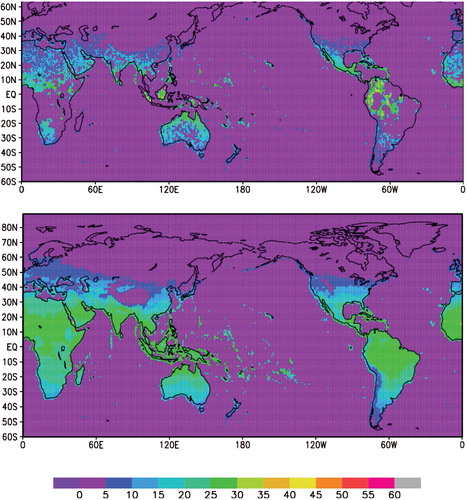
Fig. 2. The set up of climate runs and the system to extract data for a particular grid of an atmospheric model provided with the lake depth. We run the lake model FLake globally on the 1° longitude–latitude grid for 20 yr with the atmospheric forcing from Sheffield et al. (Citation2006) obtaining long-term average values (LTA). We do this 12 times as if the whole globe was covered with imitative lakes differing in depth (1 m, 3 m … 50 m). Then, we extract data for each grid box of a particular NWP model grid considering the lake depth provided.
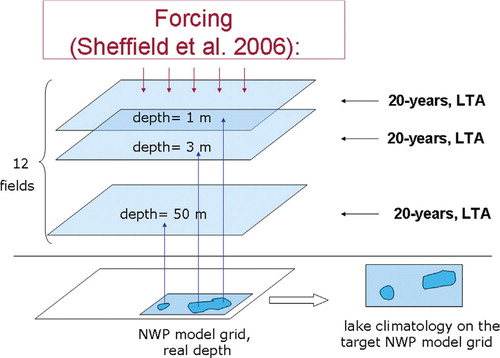
Fig. 3. Examples of the output from the system presented in (see text for details). (a) Climate field of mean water temperature, °C for July, 1, for the domain of atmospheric model in longitude–latitude coordinates with 0.02° resolution over Lake Victoria. (b) Climate field of ice depth, m for January, 1, for the domain of atmospheric model in longitude–latitude coordinates with 0.02° resolution over Sweden with Lake Vanern and partly Lake Vattern. Note different scale.
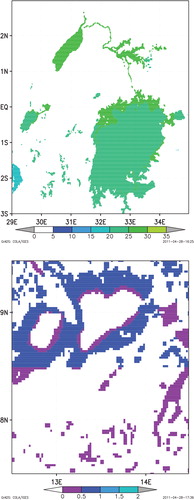
Table 1. Biases between the modelling results and the measured characteristics of the annual cycle of the water surface temperature: mean, minimum and maximum values, °C
Fig. 4. Annual cycle of the water surface temperature (x-axis: time, month; y-axis: temperature, °C). Red curves – from measurements, black curves – model lake climatology.
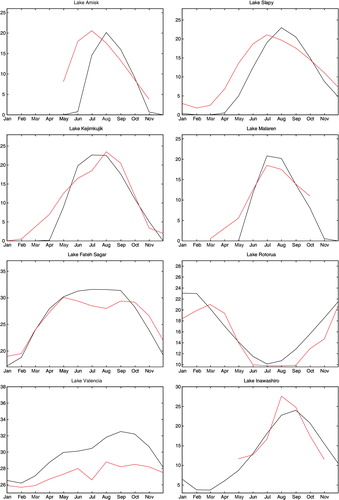
Fig. 5. Temperature profiles in Lake Amisk (x-axis – temperature, °C, y-axis – depth, m) in different months. Red curves – from measurements, black curves – model lake climatology.
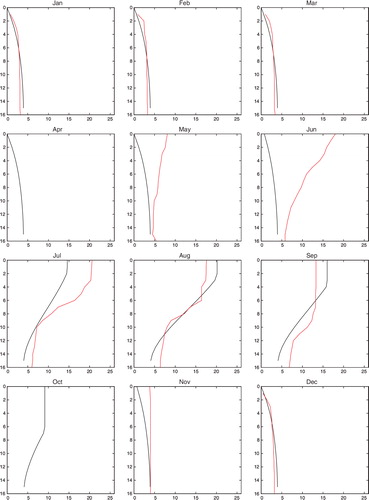
Fig. 6. The same as in , but for Lake Kejimkujik.
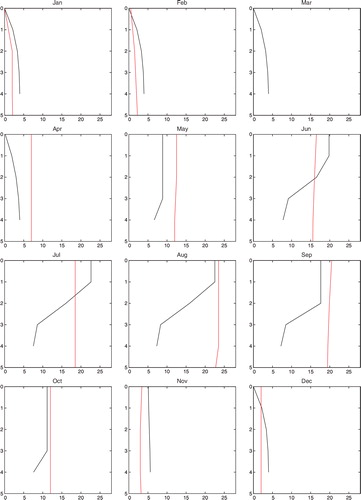
Fig. 7. The same as in , but for Lake Rotorua (see text for comments).
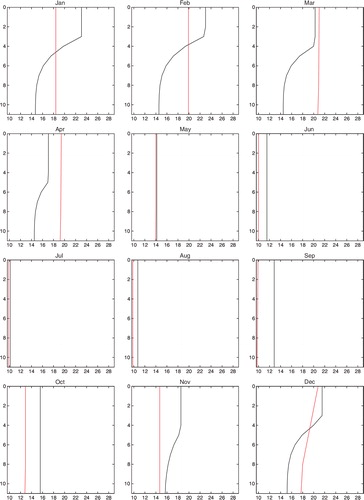
Fig. 8. The same as in , but for Lake Valencia.

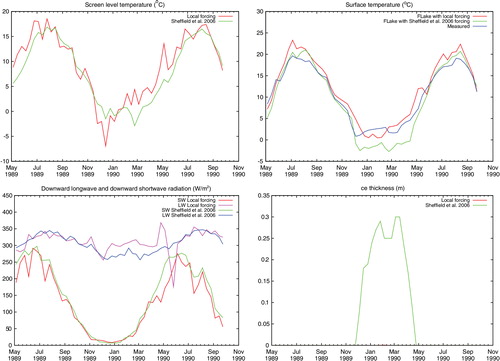
Fig. 9. Simulations for Lake Erken, Sweden, with forcing from local measurements and from Sheffield et al. (Citation2006). Note problems with measured downward long-wave radiation in the end of April–beginning of May (see text for comments).