Figures & data
Table 1. FLake and HIGHTSI experiments setup
Fig. 1. Surface elevation [m] of the HIRLAM Alaska domain. In the south-east of Alaska the location of the Bear Lake is indicated in white.
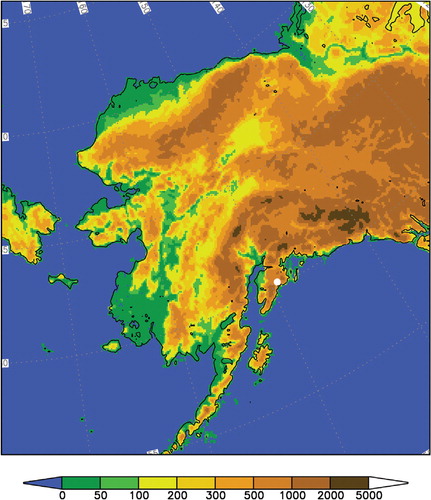
Fig. 2. Snow and ice depth and snow density measured on Bear Lake during the 2003/2004 ice season.
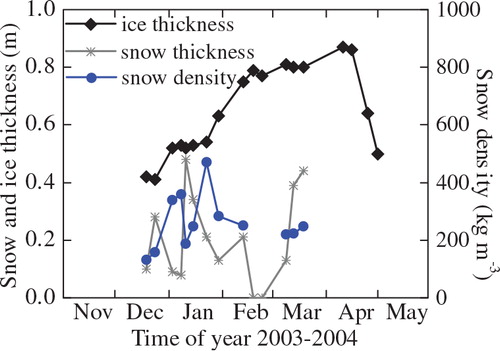
Fig. 3. The forcing data from HIRLAM model; (a) wind speed; (b) air temperature; (c) relative humidity; (d) original snow precipitation from HIRLAM (blue) and snow precipitation for T2m < 0.1 °C (red); (e) downwelling short-wave radiation; and (f) downwelling long-wave radiation.
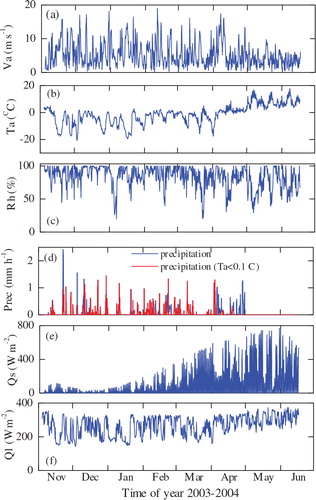
Fig. 4. Observed and FLake-simulated snow and ice depth Hs and Hi. (a) Reference FLake run and sensitivity experiment S1; (b–d) sensitivity experiments S2–S4.
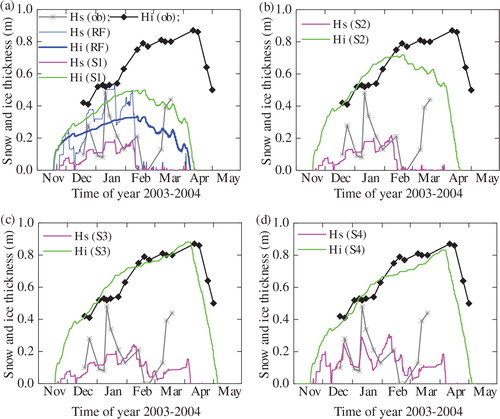
Fig. 5. Observed and HIGHTSI-simulated snow and ice depth. (a–d) model experiments H1–H4.
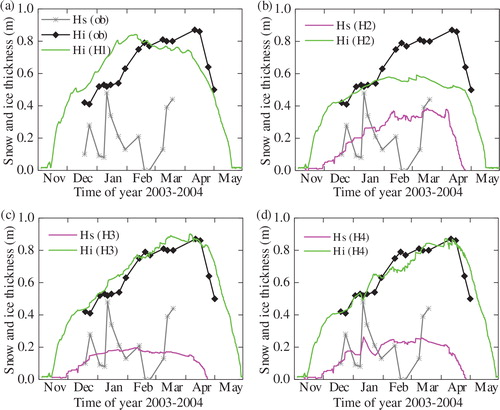
Table 2. Bias, root mean square error (RMSE) and correlation coefficient of simulated snow and ice depths compared to observations. For the bias negative values indicate an underestimation by the models and positive values an overestimation
Table 3. Comparison between simulated and measured surface temperatures (°C) for all model runs. The comparisons match the specific date and time of measurement (local noon). Bias, root mean square error (RMSE) and correlation coefficient are also given
Table 4. Comparisons between simulated and measured temperature (°C) at the snow − ice interface for all model runs. The comparisons match the specific date and time of measurement (local noon). Bias and root mean square error (RMSE) are also given. Note that the experiment H1 is excluded because snow is not considered
Table 5. Monthly mean of simulated ice depth and ice growth rate by FLake (S4) and HIGHTSI (H4)
Fig. 6. Snow-ice and superimposed ice simulated by HIGHTSI.
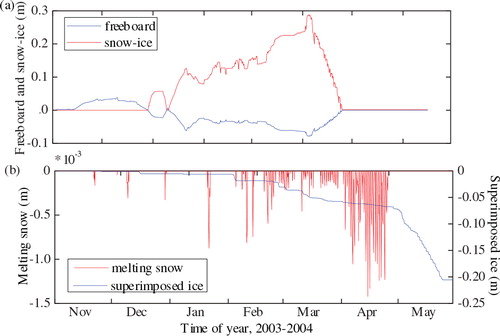
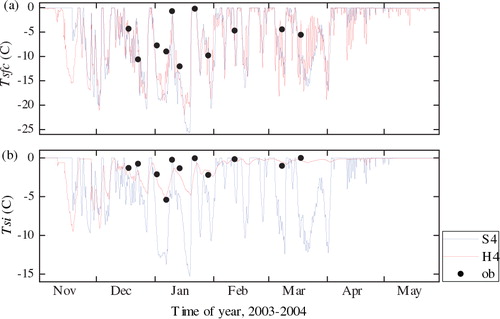
Fig. 7. The time series of observed (black points) and simulated surface temperature (T sfc), snow–ice interface temperature (T si) from S4 (blue line) and H4 (red line).