Figures & data
Table 1. List of the 16 GCMs used in the analysis of GPI for the late–20th and 21st-century
Fig. 1. Annual mean GPI for the late–20th-century climate: (a) ERA40 reanalysis, (b) NCEP reanalysis, (c) GPI: E-I mean, (d) E-I SD and (e) the COV of GPI for E-I. Units for (a)–(d) are number of cyclogenesis per 2.5° per 20 yr.
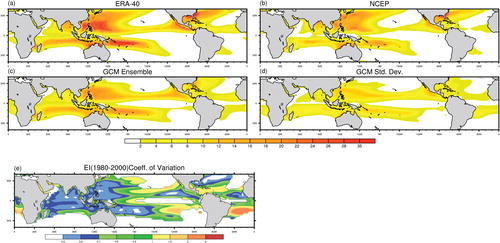
Table 2. List of GCMs used in the construction of various ensembles for the current climate and IPCC AR4 A2 scenario and ensemble names
Table 3. Annual mean of the GPI and its four components, added over seven ocean basins
Fig. 2. Annual change in GPI for the late–21st-century (2081–2100 minus 1981–2000) for the A2 scenario for the 16 CMIP3 models of E-I.
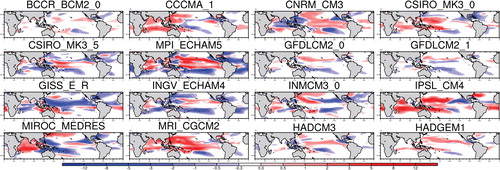
Fig. 3. (a) Ensemble average of annual change in GPI for the late–21st-century (2081–2100 minus 1981–2000) for E-I for the A2 scenario with contours showing where 75% of models agree on the sign of change, and (b) normalised change for this same period.
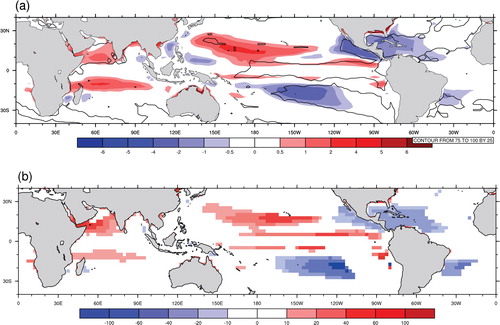
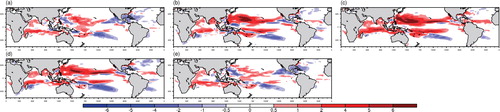
Fig. 4. Late–20th-century difference in GPI between (a) E-II and E-I, (b) E-III and E-I, (c) E-IV and E-I and (d) E-V and E-I. Contours show values which are 95% significant.
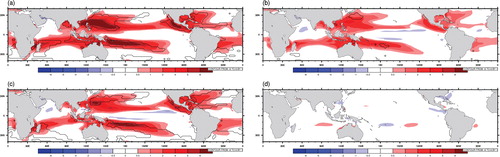
Fig. 5. Change in mean GPI between late–21st- and 20th-century climate (a) E-II, (b) E-III, (c) E-IV and (d) E-V. Contours show values which are 95% significantly different from E-I.
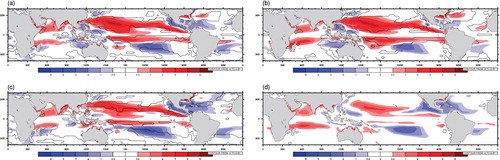
Fig. 6. Change in median GPI between late–21st- and 20th-century climate (a) E-I, (b) E-II, (c) E-III, (d) E-IV and (e) E-V.