Figures & data
Fig. 1. Observations at 0900 JST (0000 UTC), 20 May 2010. (a) Precipitation (mm h−1) observed with the Japan Meteorological Agency (JMA) radar network. (b) Sea surface temperature (°C; SST) used for the model lower-boundary condition of the CNTL run. In the SMTH run, the same SST field as in (b) is assigned at the model boundary but it has been smoothed. (c) Surface weather map by JMA. The upper part of the original figure is trimmed for better comparison with the other panels. The location of the rainband is added schematically. (d) Visible cloud image by the Geostationary Meteorological Satellite-5 available at the Kochi University (http://weather.is.kochi-u.ac.jp/).
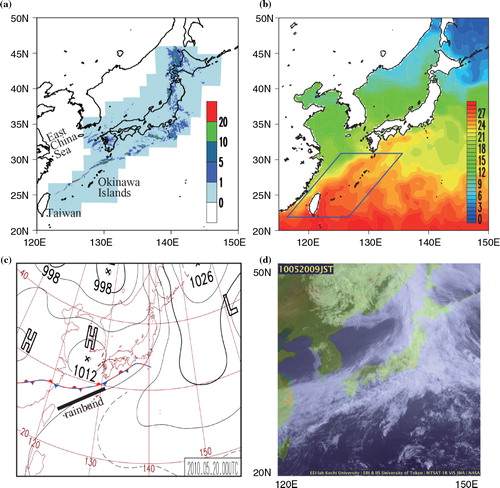
Fig. 2. Comparison of the observation and model results. (Left) SST (°C, contour) and precipitation (mm h−1, shade) based on the (a) radar observation, (b) CNTL run and (c) SMTH run. (Right) 1000-hPa specific humidity (g kg−1, shade) and wind vector (m s−1) based on the (d) JMA MSM, (e) CNTL run and (f) SMTH run. Red hatches in (d)–(f) indicate 1000-hPa wind convergence stronger than 1.0×10⁻⁴ s−1 in the CNTL and SMTH runs, respectively. Green hatch in (f) duplicates the red hatch in (e) for comparison. Meridional lines in (b) and (c) are used for . All figures at 0900 JST (0000 UTC), 20 May 2010.
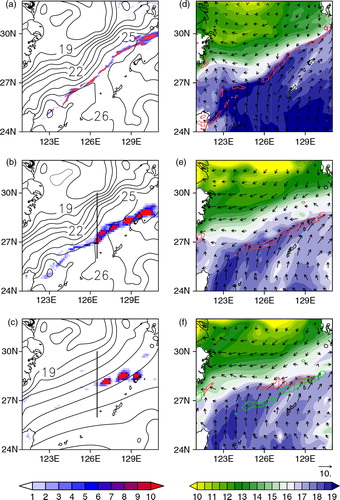
Fig. 3. Meridional vertical sections for 126.5°E (across the meridional lines in b, c) at 0900 JST (0000 UTC), 20 May 2010. (a)–(b) Equivalent potential temperature (K, shade), zonal wind velocity (greater than 12 m/s, thick black contours) and wind vector (m s−1 horizontally and Pa s−1 vertically), based on the (a) CNTL and (b) SMTH runs. Red arrows highlight wind vectors whose ageostrophic component is northward and greater than 4 m s−1, and otherwise wind vectors are indicated by black arrows. (c) Differences (CNTL minus SMTH) in specific humidity (g kg−1, shaded) and vertical velocity (Pa s−1, contour).
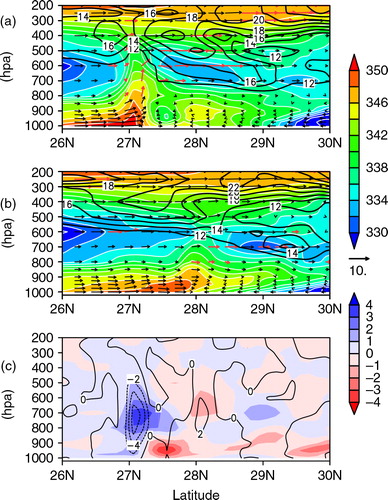
Fig. 4. Time-latitude sections for 126.5°E at 1000 hPa. (a) Specific humidity (g kg−1, shade), meridional wind velocity (m/s, vector), lines of zero meridional velocity (thick black line) and wind convergence greater than 1.0×10⁻⁴ s−1 (red hatch), simulated in the CNTL run. (b) CAPE (J kg−1, shade) and precipitation (mm h−1, contoured for 0 and 1, and hatched for precipitation greater than 1 mm h−1) of the CNTL run. (c) Differences (CNTL minus SMTH) in the column integrated water vapor (kg, shade) and CAPE (J kg−1, contoured for −40, 0 and 40 and hatched for the values greater than 40). (d) SST (K, contour) assigned for the CNTL run, and its difference from its counterpart for the SMTH run (K, shade).
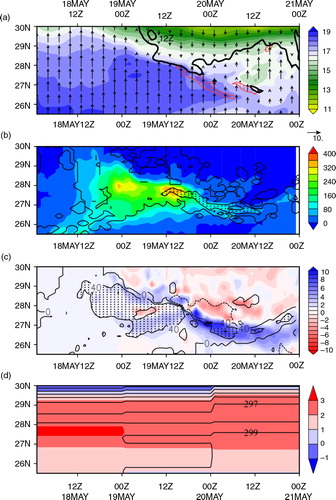
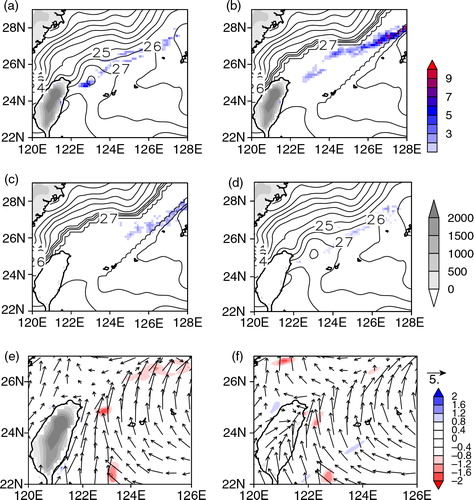
Fig. 5. Results of additional experiments. (a)–(d) Convective precipitation (mm h−1, color shade), land surface elevation (m, gray shade) and SST (°C, contour) of the individual experiments. (a) CNTL run (with realistic topography and observed SST). (b) An experiment where any SST values above 24°C near the Kuroshio have been replaced with a constant value of 27°C. (c) An experiment where the same SST as in (b) has been assigned, but the orography of Taiwan is flattened to no surface elevation. (d) An experiment where the same SST as in the CNTL run with the flattened Taiwan orography as in (c). (e)–(f) 1000-hPa wind velocity (m s−1, vector) and wind divergence over the ocean (10−4 s−1, color shade) for the (e) CNTL run and (f) experiment shown in (d). All panels are for 0900 JST (0000 UTC), 20 May 2010.