Figures & data
Fig. 1 (a) pdf of generalised normal distribution (11) with p=1 for σ=0.8 (blue), σ=0.4 (green) and σ=0.1 (red); (b) cloud fraction Φ (black) and Φ(0) for various σ as in (a); (c) Φ′ (black) and Φ(1) for various σ as in (a); (d) linearisation error assuming true pdf has σ=0.4, using the TLA (black) and the BLA with various σ as in (a).
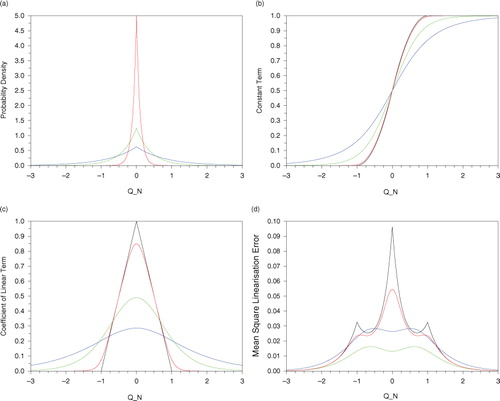
Fig. 2 100 000 iterates of the Duffing map (33) with a=2.75, b=0.15 starting from (plus sign).
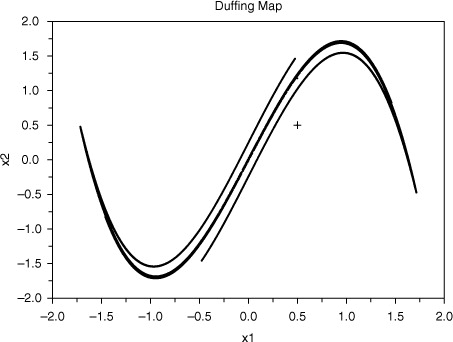
Fig. 3 Mean square analysis error for the Duffing map example, using TLA filter (black) and BLA filter (blue) for various values of the linearisation error parameter α. The dotted curve is the lowest mean square analysis error achievable using the TLA and any value of β.
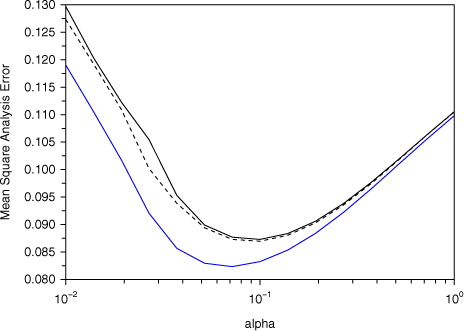
Table 1 Minimum variance smoother
Table 2 Smoother using the BLA
Table 3 Variational form of smoother using the BLA
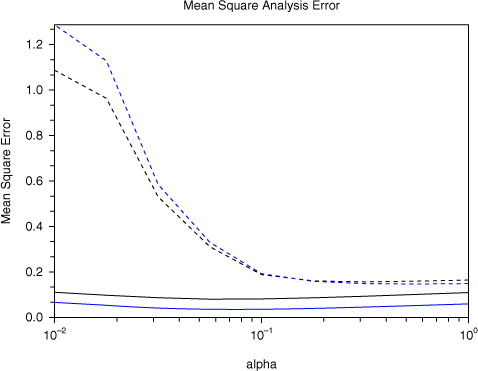
Fig. 4 Mean square analysis error for the Duffing map example for various values of the linearisation error parameter α. Filters are in black and smoothers in blue. Dotted curves use the TLA and solid curves use the BLA.
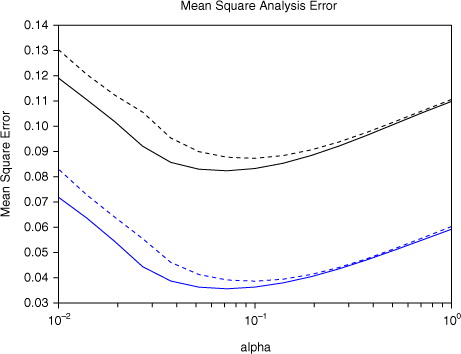
Fig. 5 Mean square analysis error in roughened Duffing map (with p=100) for various values of the linearisation error parameter α. Filters are in black and smoothers in blue. Dotted curves use the TLA and solid curves use the BLA.