Figures & data
Fig. 1 The box shows the ALADIN domain (12–20°N and 56–64°W: 850 km×850 km).
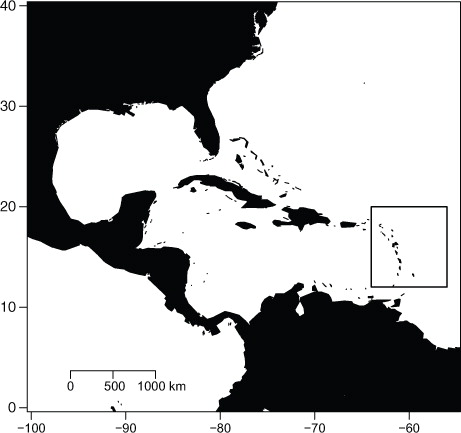
Table 1. For each island considered as land by ALADIN: area, highest elevation for ALADIN, CRU and Shuttle Radar Topography Mission (SRTM) and the number of land points in the grid of ALADIN and CRU
Fig. 2 Monthly mean precipitation over the area 12–20°N and 56–64°W, obtained from ERA-interim dataset in black with circles (median on 156 sea points), CRU2.0 dataset in black with triangles (median on 28 land points), ALADIN simulation on Land in green with triangles (median on 47 land points), ALADIN simulation on Sea in blue with circle (median on 7128 sea points) for the end of the 20th century. Units are in mm/day.
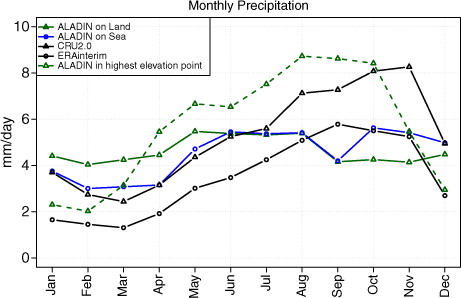
Fig. 3 Monthly mean Tmax (maximum daily temperature) over the area 12–20°N and 56–64°W, obtained from ERA-interim dataset in black with circles (median on 156 sea points), CRU2.0 dataset in black with triangles (median on 28 land points), ALADIN simulation on Land in green with triangles (median on 47 land points), ALADIN simulation on Sea in blue with circle (median on 7128 sea points) for the end of the 20th century. Units are in °C.
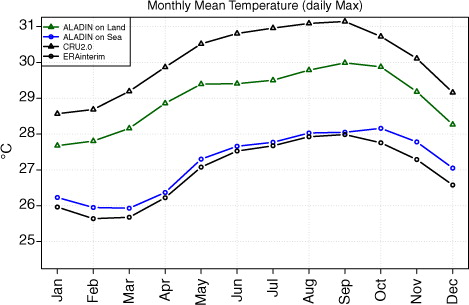
Fig. 4 Monthly mean Tmin (minimum daily temperature) over the area 12–20°N and 56–64°W, obtained from ERA-interim dataset in black with circles (median on 156 sea points), CRU2.0 dataset in black with triangles (median on 28 land points), ALADIN simulation on Land in green with triangles (median on 47 land points), ALADIN simulation on Sea in blue with circle (median on 7128 sea points) for the end of the 20th century. Units are in °C.
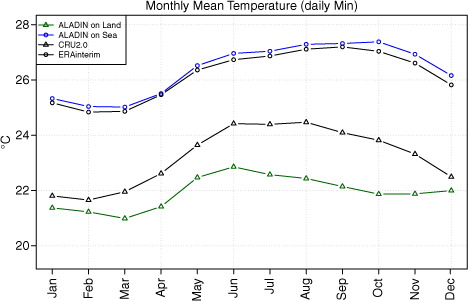
Table 2. Anomalies (median on all model points) of the monthly mean temperature between the period 1971–2000 and the period 2071–2100 according to the two scenarios (RCP4.5, RCP8.5)
Fig. 5 Projections of the seasonal mean temperature for the period 2071–2100 relative to the period 1971–2000 baseline underline two scenarios (RCP4.5 in green and RCP8.5 in red) over all islands and Sea (divided in four zones: NW, NE, SE, SW). Units are in °C.
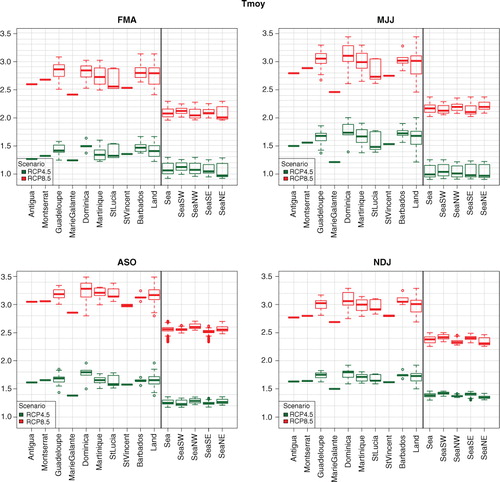
Table 3. Proportion of model points where the monthly mean precipitation increase (↗) or decrease (↘) significantly (at risk α=0.05) between the period 1971–2000 and the period 2071–2100 according to two scenarios (RCP4.5, RCP8.5)
Fig. 6 Projections of the seasonal mean precipitation for the period 2071–2100 relative to the period 1971–2000 baseline underline two scenarios (RCP4.5 in green and RCP8.5 in red) over all islands and Sea (divided in four zones: NW, NE, SE, SW). Units are in %.
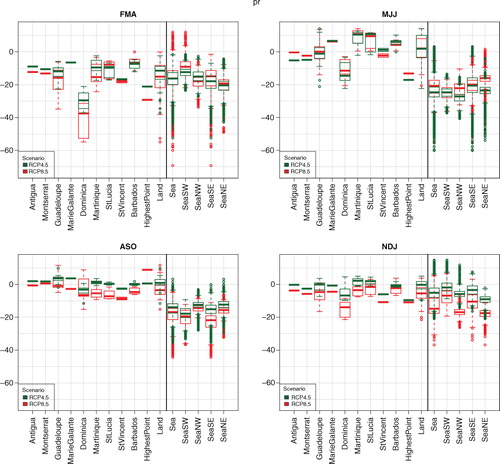
Fig. 7 Twenty-two rain-gauge stations (daily precipitation) and the 16 land points of the RCM ALADIN-climate available in Guadeloupe.
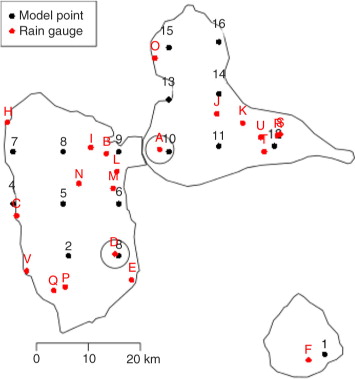
Table 4. Comparison of precipitation extreme indices between observation and the output of the RCM at the nearest model point (before and after the q–q plot correction)
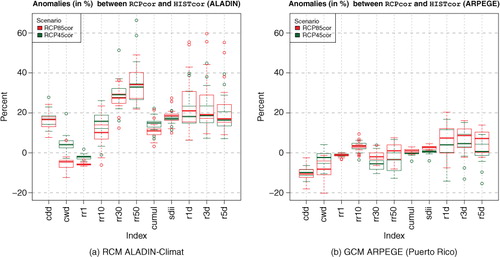
Fig. 8 Anomalies of indexes between HISTcor and RCPcor in percentage.