Figures & data
Fig. 1 TCs investigated in this study: (a) Katrina (21 August–2 September 2005) in Atlantic Basin; (b) Glenda (22–31, March 2006) of Southern Indian Basin; (c) Ketsana (15–26 October, 2003) of western North Pacific Basin; and (d) Larry (13–21 March, 2006) of Southern Pacific Basin. The IBTrACS traces are plotted as red lines. The contour lines are environmental SST, with 302–303 K hatched. The regions defined by the dashed lines (the slow advancing stage of TCs) are for vorticity tendency analysis. The black dashed lined define the 5-km nested simulation domains (i.e. Domain 2s).
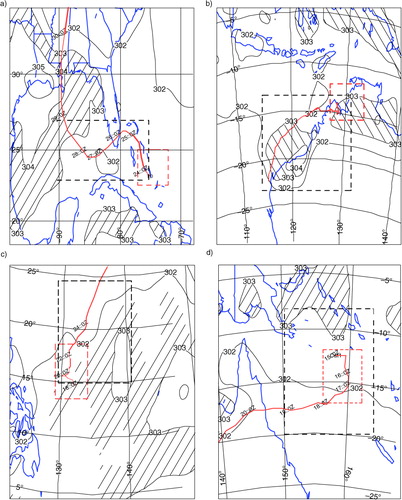
Table 1. Life cycles and attributes of the TCs investigated
Fig. 2 NCEP/NCAR reanalyses of the lower level (600 hPa for Katrina and 850 hPa for Ketsana and Larry) streamlines, wind speeds (dashed lines, m/s) and relative vorticities (colour shades, 10−5 Hz) at 1 d lead time of the TC formation alert (TCFA). The formation environments are shown for Katrina, Ketsana and Larry. Katrina forms as a perturbation in the eastern waves, while Ketsana and Larry are formed inside ITCZ. Larry formed at the maxima in the southern extension of the ITCZ (red dashed lines). The red dashed lines are the approximate locations of ITCZ (also called monsoon shear line).
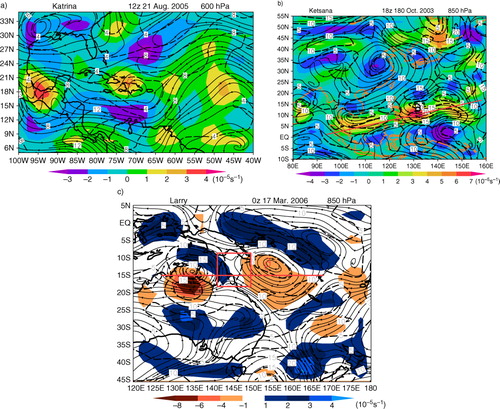
Fig. 3 Time-height diagram of the area-average (a sector leading the IBTrACS observed TC location at the formation stage, ~5 by 5° region defined by the dashed line boxes in ) vorticity tendencies (10−11s−2) for Ketsana 2003. The panels (from top to bottom) are organised as (a) horizontal advection, (b) vertical advection, (c) stretching, (d) tilting, (e) baroclinicity, and (f) the sum of all above terms. The TC moves toward the direction of fastest increase in cyclonic vorticity. Stretching always is the most important term for positive vorticity production. In the vertical advection (b) term, from 18z 17 October to 0 z 19 October 2003, there is apparent bottom-up tendency in vorticity generation. In (f), the bottom-up extension also is apparent from 0z 17 October to 12z 18 October (when it becomes a tropical depression).
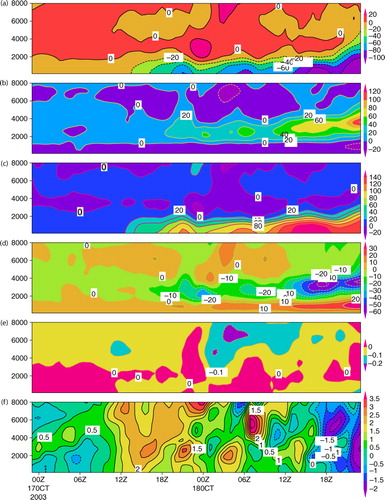
Fig. 4 Same as , but for TC Glenda 2006. Unlike Ketsana, top-down advection is more significant in relative vorticity production for Glenda [(a), (b) and (d)]. The initial centres of large negative (cyclonic in SH) vorticities are located at ~10 km and is gradually advected downward, in agreement with the fact that Glenda is a re-development of Larry. In this case, tilting works also in synergy with vertical advection. Note that the relative vorticity production is directly proportional to absolute vorticity value, making it impossible for comparison of the magnitude of each term across TCs of different basins.
![Fig. 4 Same as Fig. 3, but for TC Glenda 2006. Unlike Ketsana, top-down advection is more significant in relative vorticity production for Glenda [(a), (b) and (d)]. The initial centres of large negative (cyclonic in SH) vorticities are located at ~10 km and is gradually advected downward, in agreement with the fact that Glenda is a re-development of Larry. In this case, tilting works also in synergy with vertical advection. Note that the relative vorticity production is directly proportional to absolute vorticity value, making it impossible for comparison of the magnitude of each term across TCs of different basins.](/cms/asset/5ac426df-d165-4475-bb26-eff06d24d802/zela_a_11817009_f0004_ob.jpg)
Fig. 5 Structure of Katrina (2005) from the WRF-ARW simulation. Typical features necessary for the tracker (to detect TCs) are resolved, including: quasi-axisymmetric shape (a), wind speed (b) maximum just above the planetary boundary layer (~850 hPa), and an upper level (750–200 hPa) warm core (c). In Panel (a), contour lines are surface level pressure (hPa) and shades are precipitation (accumulated total amount up to the labelled time, mm). The vector fields are 850-hPa winds; (b) shows the vertical cross-section of wind speeds along 25°N [red line in Panel (a)]. (c) shows the temperature cross-section along the red line in (a). The dashed blue lines are specific humidity (g/kg); (d) is vertical wind speed along the same cross-section. The roughly horizontal lines are the geopotential heights (in dm). Model time is 28 August 2005.WRF simulations have more details than NCEP/NCAR reanalyses (not shown). For example, there are downdrafts in the sector with strong precipitation [blue blob in (d)]. The maximum vertical movement occurs around 500 hPa (reaching ~5 m/s), agree with the airplane surveys of four Atlantic mature TCs by Jorgensen (Citation1984a, 1984Citationb). Most of the troposphere is warmer than environment (700–200 hPa), warm core is around 250 hPa. Not shown is the cold core above 100 hPa, caused by strong radiative cooling when the convective tower is penetrating above the equilibrium level. Panel (c) also indicates that Katrina has a moist core, indicating that the most active convective activity occur inside the 70 km (from centre) inner region, becoming close to environmental mean at about 5° latitudinal distance. Outside the ~120 km inner region, where upward motion dominates, there are complex alternating patterns of upward and downward (blue) regions (d).
![Fig. 5 Structure of Katrina (2005) from the WRF-ARW simulation. Typical features necessary for the tracker (to detect TCs) are resolved, including: quasi-axisymmetric shape (a), wind speed (b) maximum just above the planetary boundary layer (~850 hPa), and an upper level (750–200 hPa) warm core (c). In Panel (a), contour lines are surface level pressure (hPa) and shades are precipitation (accumulated total amount up to the labelled time, mm). The vector fields are 850-hPa winds; (b) shows the vertical cross-section of wind speeds along 25°N [red line in Panel (a)]. (c) shows the temperature cross-section along the red line in (a). The dashed blue lines are specific humidity (g/kg); (d) is vertical wind speed along the same cross-section. The roughly horizontal lines are the geopotential heights (in dm). Model time is 28 August 2005.WRF simulations have more details than NCEP/NCAR reanalyses (not shown). For example, there are downdrafts in the sector with strong precipitation [blue blob in (d)]. The maximum vertical movement occurs around 500 hPa (reaching ~5 m/s), agree with the airplane surveys of four Atlantic mature TCs by Jorgensen (Citation1984a, 1984Citationb). Most of the troposphere is warmer than environment (700–200 hPa), warm core is around 250 hPa. Not shown is the cold core above 100 hPa, caused by strong radiative cooling when the convective tower is penetrating above the equilibrium level. Panel (c) also indicates that Katrina has a moist core, indicating that the most active convective activity occur inside the 70 km (from centre) inner region, becoming close to environmental mean at about 5° latitudinal distance. Outside the ~120 km inner region, where upward motion dominates, there are complex alternating patterns of upward and downward (blue) regions (d).](/cms/asset/b57abf92-47b5-4699-a100-2e8e6d50eac7/zela_a_11817009_f0005_ob.jpg)
Fig. 6 Same as but for TC Glenda (at 12z 28 March 2006). Unlike the other three TCs, it has a higher level maximum velocity core at 450 hPa, an indication that it is a re-development of an upper level cyclonic vortex of Larry. A top-down vorticity generation mechanism also accounts for its initial stage intensification, as expected.
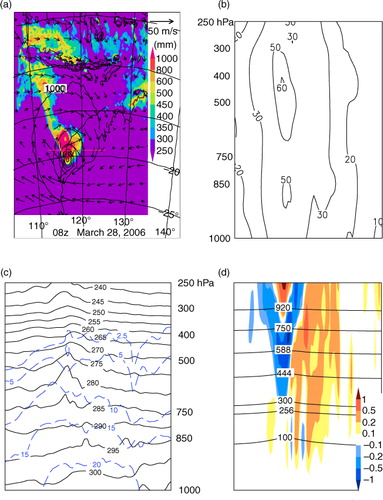
Fig. 7 Same as but for TC Ketsana. Among the four TCs, Ketsana (a non-landfalling TC) produced the most (cumulative until 00z 24 October, as labelled) precipitation. Its kinetic energy also is the largest among the four TCs studied here. The energy conversion efficiency is similar among the four.
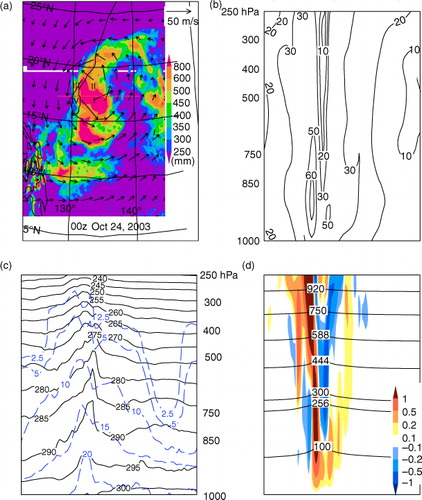
Fig. 8 Same as but for TC Larry.
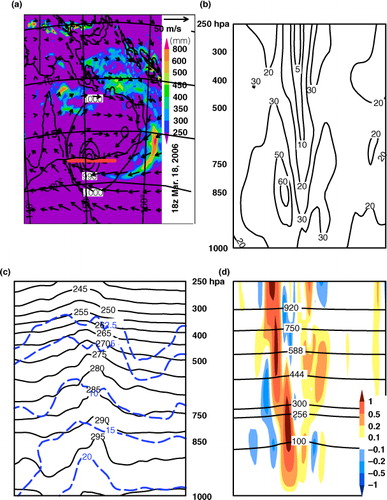
Fig. 9 Comparison of Katrina simulated and TRMM observed precipitation rates (mm/hr). Left panels are TRMM 3B42RT observations, middle panels are WRF simulations and right panels are the differences between TRMM observations and WRF simulations.
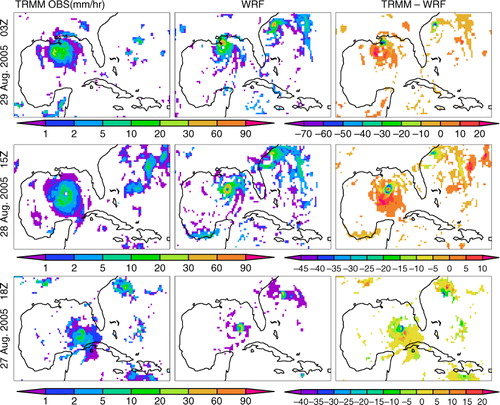
Fig. 10 Sensitivity of TC tracks to SST. (a) for Katrina, (b) for Larry, (c) for Glenda and (d) for Ketsana. For all cases, TCs cannot form if SST were 2° lower than reality. In fact, TCs will not form for a 1° colder SST over the southern Indian Ocean basin. If temperatures are higher, the tracks tend to recurve over the sea but spend less overall time before making landfall. Also, as temperature increases, the secondary circulation also tends to form a ‘weaker’ hurricane, for the case of Katrina [there will be another smaller scale TC tracing along the eastern coast of Florida, blue dashed curve in (a)]. For Larry, stronger TCs tend to take a more northerly track, because the saddle atmospheric circulation (the box in c) usually provides anticyclonic vorticity that sends the TCs southward (working in synergy with the beta effect). This TC behaviour is due primarily to stronger steering currents.
![Fig. 10 Sensitivity of TC tracks to SST. (a) for Katrina, (b) for Larry, (c) for Glenda and (d) for Ketsana. For all cases, TCs cannot form if SST were 2° lower than reality. In fact, TCs will not form for a 1° colder SST over the southern Indian Ocean basin. If temperatures are higher, the tracks tend to recurve over the sea but spend less overall time before making landfall. Also, as temperature increases, the secondary circulation also tends to form a ‘weaker’ hurricane, for the case of Katrina [there will be another smaller scale TC tracing along the eastern coast of Florida, blue dashed curve in (a)]. For Larry, stronger TCs tend to take a more northerly track, because the saddle atmospheric circulation (the box in Fig. 2c) usually provides anticyclonic vorticity that sends the TCs southward (working in synergy with the beta effect). This TC behaviour is due primarily to stronger steering currents.](/cms/asset/eba51e2f-090d-4d3c-bf23-b9fe92a782bd/zela_a_11817009_f0010_ob.jpg)
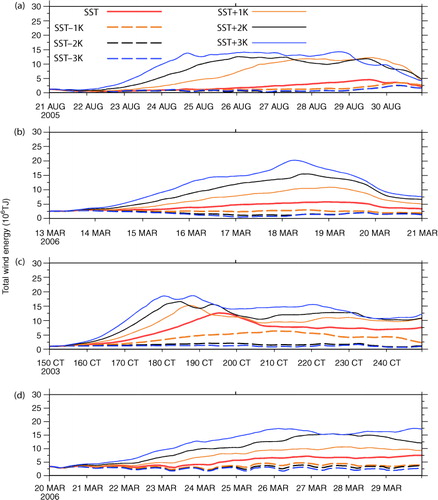
Fig. 11 Sensitivity of TC wind energy to SST. (a) for Katrina, (b) for Larry, (c) for Ketsana, and (d) for Glenda. For all cases, TCs strengthen unanimously with increasing SSTs. The wind energy is only 25% of the latent heat released with the precipitation for Katrina and 30% for Larry. For a fair comparison among TCs from different basins, the threshold wind speed is set to one tenth of the peak wind speed, which is about 5 m/s for all category-5 TCs. This minimises the effects of using different simulation domain sizes. Except for Ketsana, the total kinetic energy peaks immediately before landfall. For the maritime TC Ketsana, its energy reduces gradually as it approaches higher latitudes (with reduced moisture fuel). The higher the SST, the faster the TC moves (note the peak timing of each curve). These also agree with the well-known SST criteria for TC formation (>26.5°C).