Figures & data
Fig. 1 Various parameterised and measured drag coefficients (data were reproduced except Östergarnsholm data and Southern Ocean data). Red+signs are data measured from the ocean side of the air–sea interface (Jarosz et al., Citation2007); black squares are GPS dropsonde data (Powell et al., Citation2003); blue×signs are eddy-correlation data from Östergarnsholm for wind speeds over 15ms−1 (Högström et al., Citation2008); black+signs are data from the Southern Ocean (Sahlée et al., Citation2012); cyan×signs are high wind speed CBLAST data (Bell et al., Citation2012); black×signs are typhoon data from the Pacific Ocean (Potter et al., 2014).
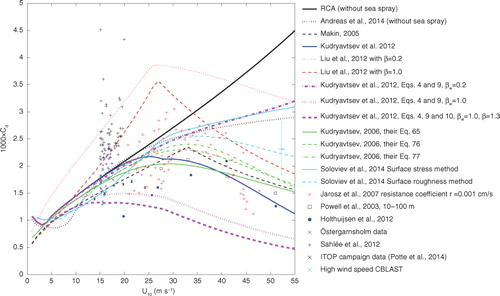
Fig. 2 Comparison of wave state impact on the drag coefficient in the newly proposed parameterisation: (a) parameterisation with eqs. (5) and (9); (b) parameterisation with eqs. (5), (9) and (10).
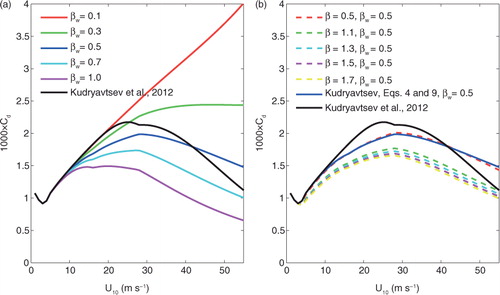
Fig. 3 The domain of the RCA model used in this study (red box area); the red×is the FINO1 site; the blue box area is the area shown in and ; the blue×indicates the centre of storm Uill at time 2012-01-03:12 (discussed in Section 6.3).
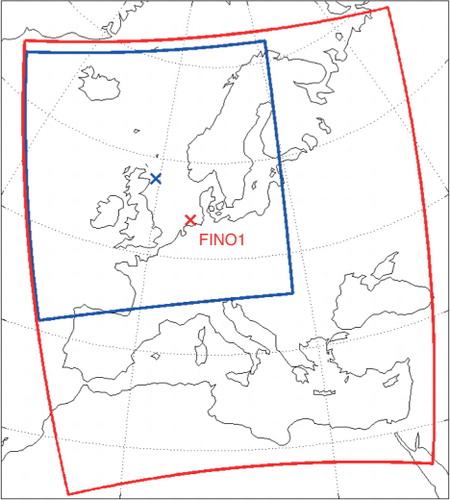
Table 1. Wind stress and heat fluxes parameterisations for the various simulations
Fig. 4 Modelled wind speed results compared with FINO1 measurements at a height of 33 m: (a) January 2005, (b) January 2007 and (c) January 2012.
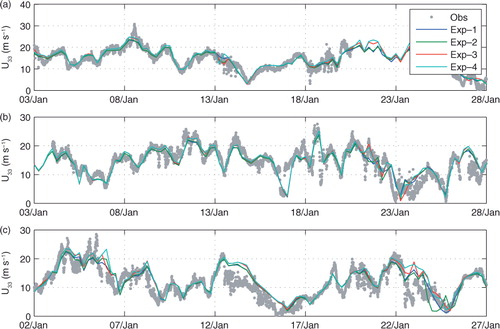
Fig. 5 Statistical results for wind speed measured at a height of 33m (a) mean error, (b) mean absolute error and (c) root mean square difference.
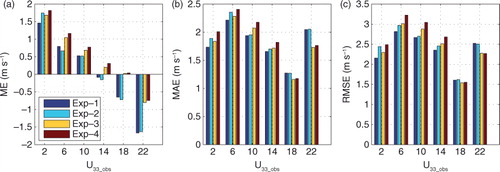
Table 2. Comparative statistics for the wind speed results at a height of 33 m; bias or mean error (ME), mean absolute error (MAE), root mean square error (RMSE) and Pearson correlation coefficient (R)
Table 3. Comparative statistics for the temperature results at a height of 100m; bias or mean error (ME), mean absolute error (MAE), root mean square error (RMSE) and Pearson correlation coefficient (R)
Table 4. Comparative statistics for the different wind speed range results at a height of 33 m; bias or mean error (ME), mean absolute error (MAE) and root mean square error (RMSE)
Fig. 6 Same as in , but for temperature measured at a height of 100m compared with the second model layer (about 100 m).
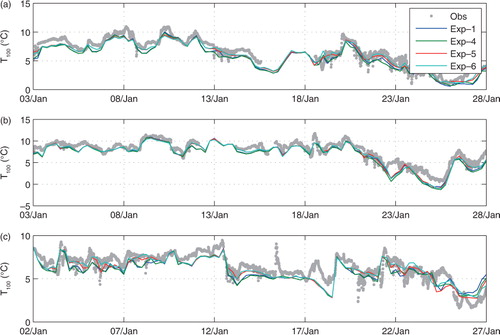
Fig. 7 Statistical results for temperature measured at a height of 100 m: (a) mean error, (b) mean absolute error and (c) root mean square difference.
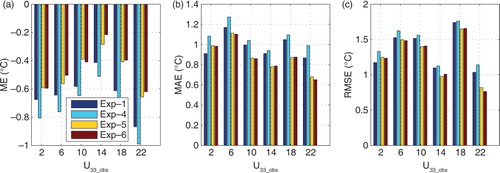
Fig. 8 The storm tracks represented by the minimum sea level pressure every three hours: (a) Gero, (b) Erwin/Gudrun, (c) Kyrill, (d) Ulli, (e) Patrick and (f) Klaus.
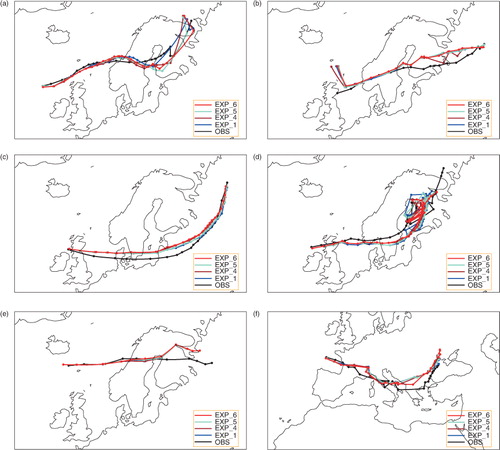
Table 5. The mean absolute error (MAE) of the minimum sea level pressure centre (km)
Fig. 9 The minimum sea level pressure of different storms over time: (a) Gero, (b) Erwin/Gudrun, (c) Kyrill, (d) Ulli, (e) Patrick and (f) Klaus.
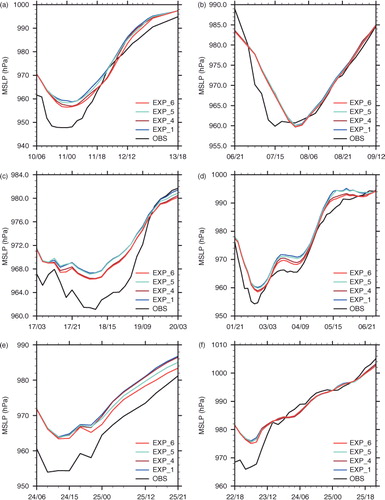
Table 6. The mean absolute error (MAE) of the minimum sea level pressure (hPa)
Fig. 10 The maximum wind speed at 925 hPa of different storms over time: (a) Gero, (b) Erwin/Gudrun, (c) Kyrill, (d) Ulli, (e) Patrick and (f) Klaus.
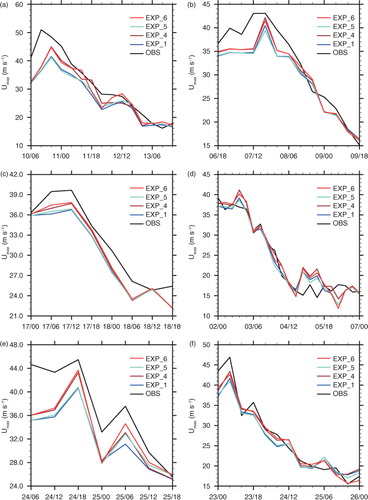
Table 7. The mean absolute error (MAE) of the maximum wind speed at 925 hPa (ms−1)
Fig. 11 The simulation results from the control experiment (Exp-1) at time 2012-01-03:12: (a) wind speed (m s−1) at 10m and sea level pressure (h Pa), (b) significant wave height (m), (c) air temperature at 2m (°C), (d) humidity at 2m (g kg−1), (e) latent heat flux (W m−2) and (f) sensible heat flux (W m−2). The black×is the centre of the storm in this time step.
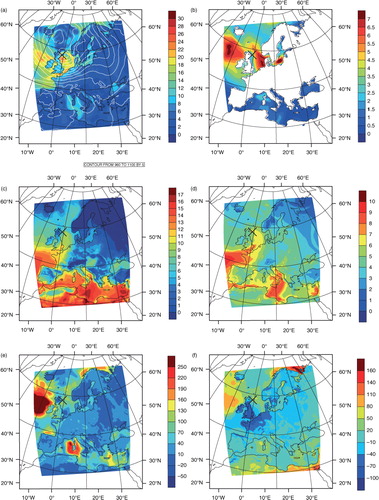
Fig. 12 Difference in sea level pressure (hPa) from that of Exp-1 at time 2012-01-03:12: (a) Exp-3 – Exp-1, (b) Exp-4 – Exp-1, (c) Exp-5 – Exp-1 and (d) Exp-6 – Exp-1. The red×is the centre of the storm in this time step.
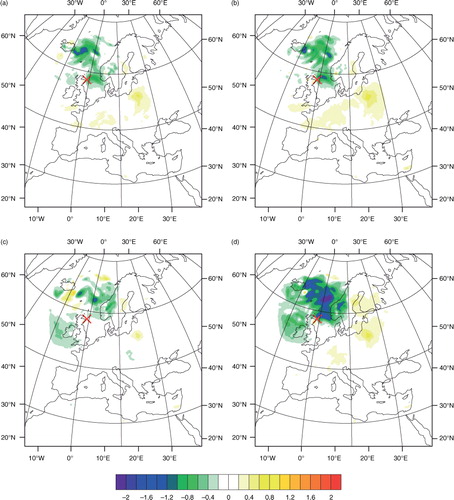
Fig. 13 Difference in wind speed at 10m (m s−1) from that of Exp-1 at time 2012-01-03:12: (a) Exp-3 – Exp-1, (b) Exp-4 – Exp-1, (c) Exp-5 – Exp-1 and (d) Exp-6 – Exp-1. The red×is the centre of the storm in this time step.
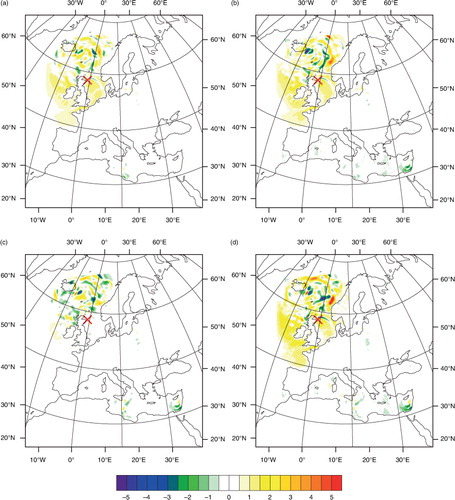
Fig. 14 Difference in heat flux (i.e. sensible heat flux and latent heat flux) (W m−2) from that of Exp-1 at time 2012-01-03:12: (a) Exp-3 – Exp-1, (b) Exp-4 – Exp-1, (c) Exp-5 – Exp-1 and (d) Exp-6 – Exp-1. The red×is the centre of the storm in this time step.
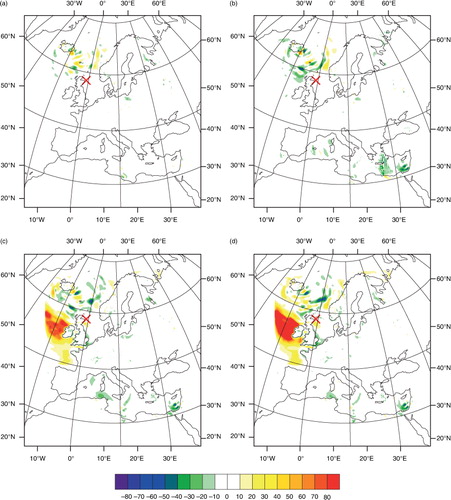
Fig. 15 Difference in wave age from that of Exp-1 at time 2012-01-03:12: (a) Exp-3 – Exp-1, (b) Exp-4 – Exp-1, (c) Exp-5 – Exp-1 and (d) Exp-6 – Exp-1. The red×is the centre of the storm in this time step.
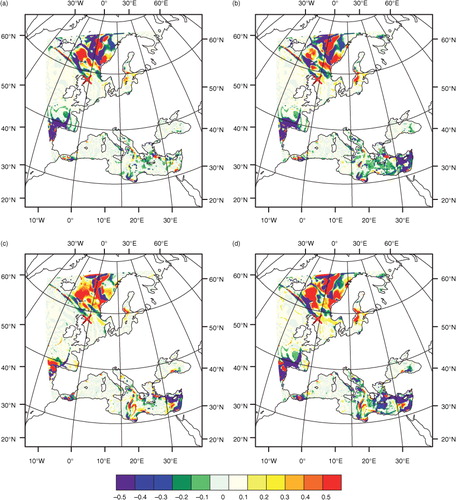
Fig. 16 Difference in wind wave age from that of Exp-1 at time 2012-01-03:12: (a) Exp-3 – Exp-1, (b) Exp-4 – Exp-1, (c) Exp-5 – Exp-1 and (d) Exp-6 – Exp-1. The red×is the centre of the storm in this time step.
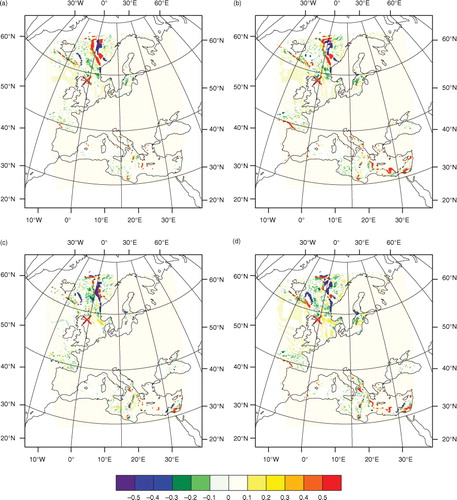
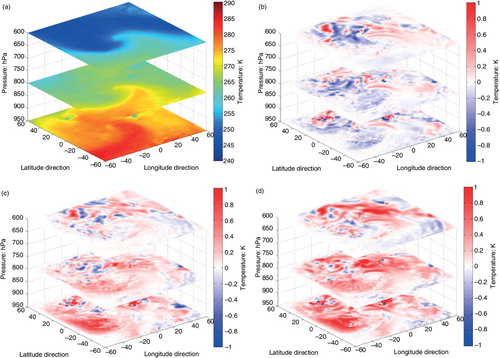
Fig. 17 Difference in humidity from that of Exp-1 at different heights at time 2012-01-03:12: (a) Exp-1, (b) Exp-4 – Exp-1, (c) Exp-5 – Exp-1 and (d) Exp-6 – Exp-1.
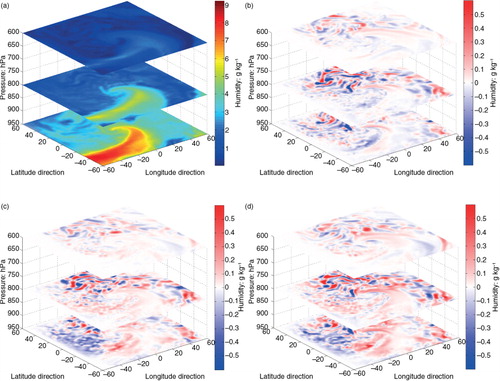
Fig. 18 Difference in temperature from that of Exp-1 at different heights at time 2012-01-03:12: (a) Exp-1, (b) Exp-4 – Exp-1, (c) Exp-5 – Exp-1 and (d) Exp-6 – Exp-1.