Figures & data
Fig. 1 Sums over the 3-days experimental period. (a): Approximated observation impact. (b): σb/σ o . (c): Number of observations. AIREP: Aircraft, PROF: Wind profiler, SYNOP: Surface stations, TEMP: Radiosondes. Verified with all quality-controlled observations between 3 and 6 hours forecast lead time.
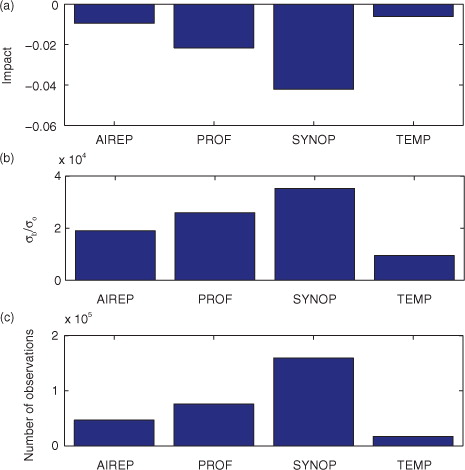
Table 1. Number of stations that correspond to one wind profiler in the sense of observation impact
Fig. 2 Relative impact of different observed variables: Total impact for each observed variable divided by the respective number of observations and by the impact of all observations. Additionally red bars show the corresponding negative σ b /σ o .
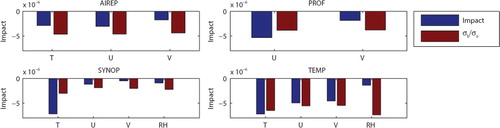
Fig. 3 Total impact summed over the experimental period for each observing station.
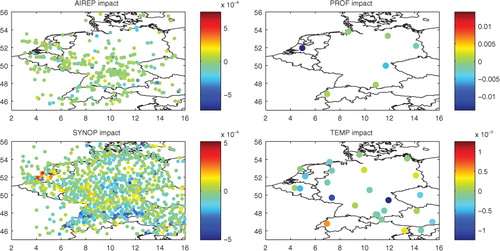
Fig. 4 Approximated observation impact summed over the experimental period using different observation types for verification.
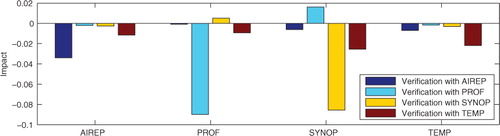
Table 2. Impact estimates using different verification norms based on eqs. (4) and (7) and surface pressure observations ( J PS ). Numbers in subscript denote the verification weights α [eq. (8)] for AIREP/PROF/SYNOP/TEMP
Fig. 5 Same as , but using verification in model space.
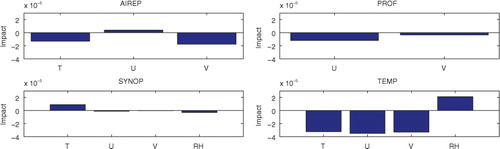
Fig. 6 Histogram of observation impact values (green) with mean value (red) and fitted stretched exponential (blue).
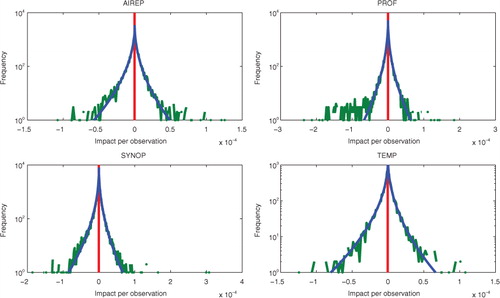
Table 3. Unfitted impact, fitted impact and their ratio
Fig. 7 Cumulative distribution function of observation impact from experiment (green) and fit (blue).
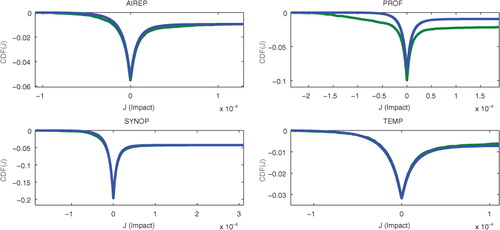
Fig. 8 Time series of the impact of the Cabauw wind profiler (PROF).
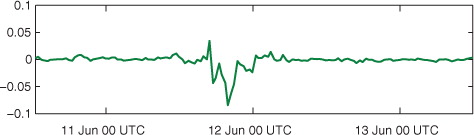
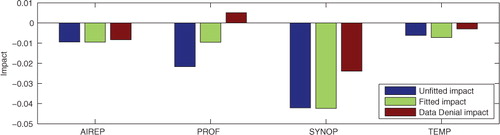
Fig. 9 Unfitted, fitted and data denial (OSE) observation impact summed over the experimental period.