Figures & data
Table 1. Characterisation of AMSR2 channels
Fig. 1 Weighting functions of AMSR2 channel 5 to channel 12 at 10.65 GHz (red), 18.7 GHz (green), 23.8 GHz (blue) and 36.5 GHz (cyan), calculated using CRTM based on the U.S. standard atmosphere.
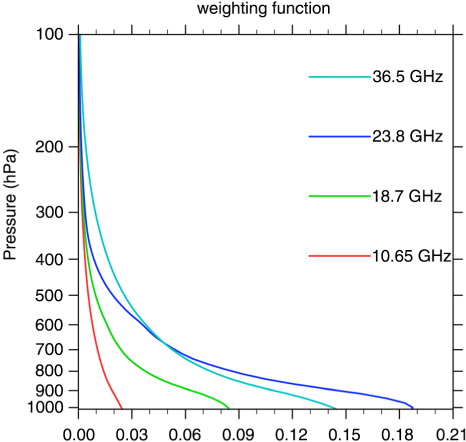
Table 2. Resampled AMSR2 level-1R products
Table 3. Quality control thresholds for absolute innovation and CLWP check
Table 4. Observation errors for AMSR2 channels assimilated
Fig. 2 Mean (a) and standard deviation (b) of AMSR2 23.8 GHz-V OMB binned as a function of C37 for data from 0600 UTC 21 October to 1800 UTC 31 October 2012. The C37 is derived from the background (green), observation (red) or the average of the two (blue). Bin size is 0.05 in C37.
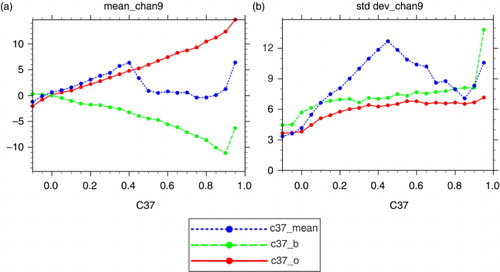
Fig. 3 The best track of Sandy from the National Hurricane Center (NHC) from 1800 UTC 21 October to 1200 UTC 31 October.
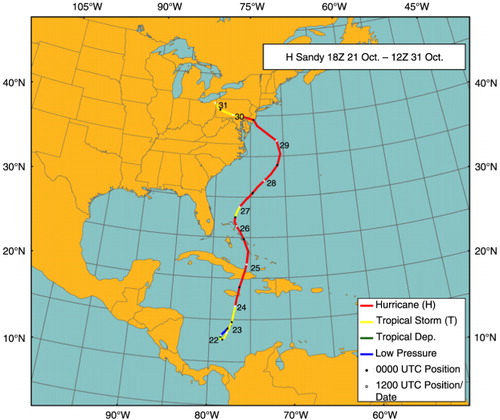
Fig. 4 The distribution of observations used in the CON experiment at 1200 UTC 27 October 2012. The numbers of each observation are marked on the right.
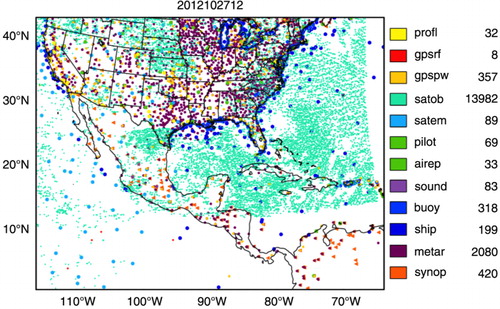
Fig. 5 MODIS image of Sandy (a), AMSR2 23.8 GHz-V images at 1800 UTC 27 October within a ±3-h time window from the observed (b), CRTM-simulated background brightness temperatures (K) from the CLRSKY experiment with clear-sky CRTM (c) and the ALLSKY experiment with all-sky CRTM (d).
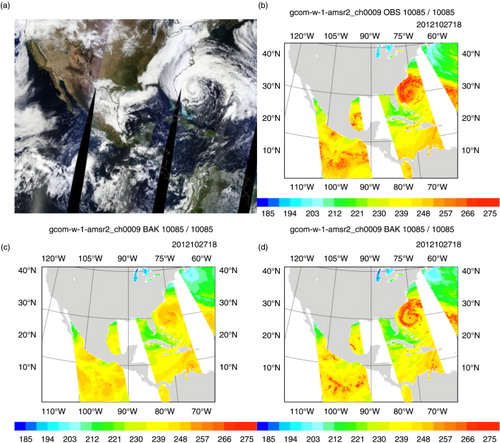
Fig. 6 The coverage of AMSR2 channel 9 brightness temperature (K) assimilated only in the ALLSKY experiment at 1800 UTC 27 October 2012.
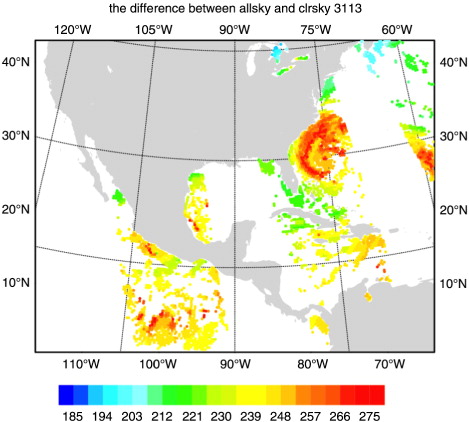
Table 5. The numbers of extra pixels assimilated in the ALLSKY experiment at 1800 UTC 27 October 2012
Fig. 7 (Top row) The surface wind vectors and sea level pressure (colour-shaded) at 1800 UTC 27 October from the analyses of ECMWF (a), CON (b), CLRSKY (c) and ALLSKY (d). Same as the top row, but for the west-east cross-sections of horizontal wind speed (second row, e–h) and temperature anomaly (third row, i–l) through the vortex centre. The x-axis of (e)–(l) is grid number along the black line in (a).
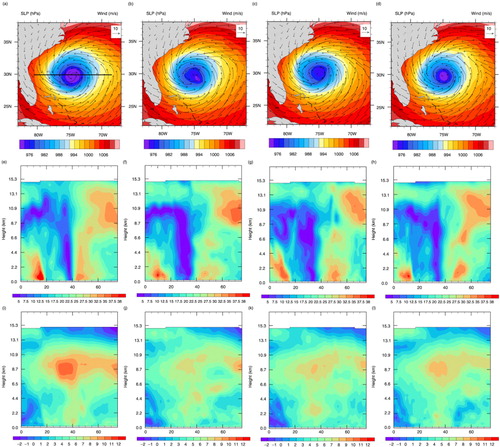
Fig. 8 The analysed brightness temperatures (K) of AMSR2 23.8 GHz-V (b–d), CLWP (kg/m2) (f–h), and TPW (kg/m2) (i-l) from the CON, CLRSKY and ALLSKY experiments at 1800 UTC 27 October, compared with the observed brightness temperatures (a), the level-2 CLWP product (e) and TPW product (i).
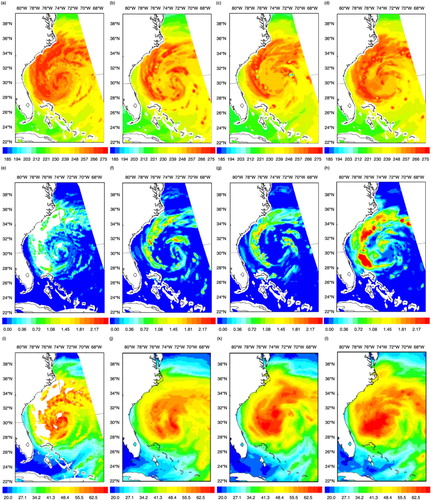
Fig. 9 The best track (black) and 72-h forecast tracks from the CON (blue), CLRSKY (red) and ALLSKY (green) experiments started from 1200 UTC 27 October.
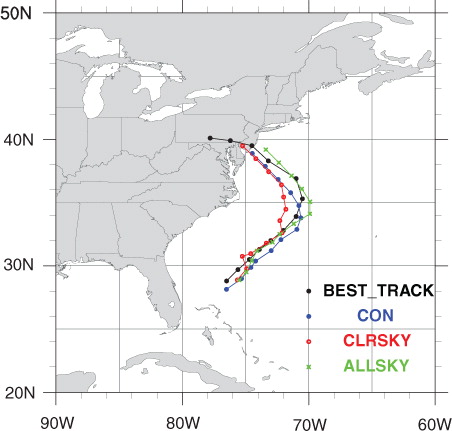
Fig. 10 Aggregated absolute track errors (a) and mean central sea level pressure errors (b) as a function of forecast range from three experiments. The error statistics are obtained from 13 72-h forecasts.
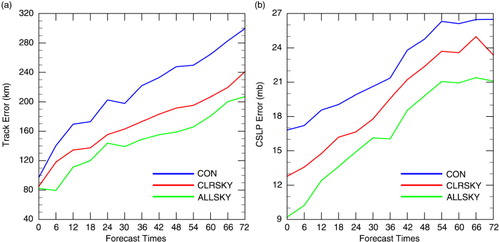
Fig. 11 The aggregated root-mean-square-error of 48-h (a) and 72-h (b) forecasts for vector wind, temperature, geopotential height and specific humidity against the ECMWF analyses. The error statistics are obtained from 13 72-h forecasts.
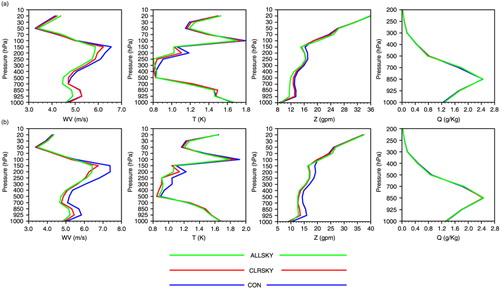
Fig. 12 The 24-h accumulated rainfall (mm) from 1200 UTC 29 to 1200 UTC 30 October 2012 from the Stage IV analysis (a), and the forecast from CON (b), CLRSKY (c) and ALLSKY (d). All forecasts are initialised at 1200 UTC 29 October 2012.
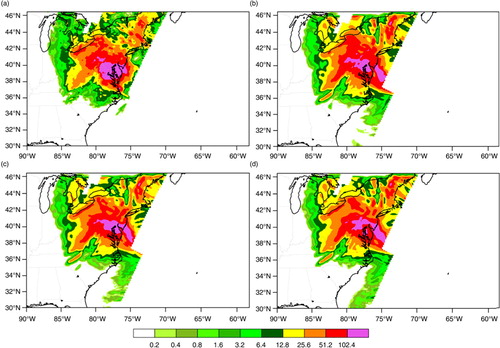
Fig. 13 The threat scores of 24-h accumulated rainfall from 1200 UTC 29 to 1200 UTC 30 October for the three experiments at 10, 20, 30, 50, 80 and 100 mm precipitation thresholds.
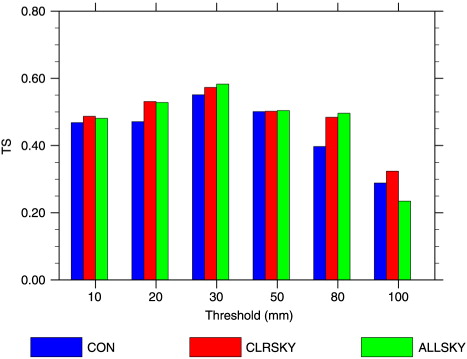
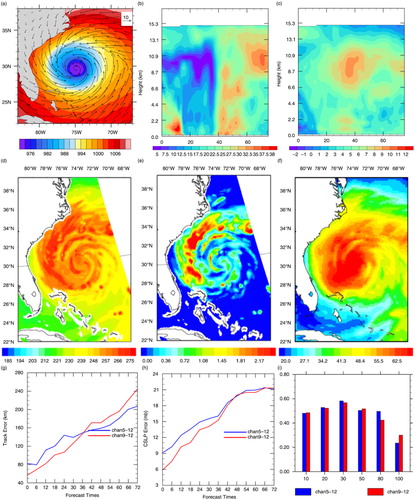
Fig. 14 The analysis at 1800 UTC 27 October 2012 from the experiment ‘CHAN9-12’: (a) the SLP and surface wind, (b) the west-east cross section of horizontal wind speed and (c) temperature anomaly along the black line in a, (d) brightness temperature, (e) CLWP and (f) TPW. 72 h forecast track error (g), CSLP error (h) and TS (i) for 24 h accumulated precipitation from 1200 UTC 29 October to 1200 UTC 30 October are shown for both CHAN9-12 (red) and CHAN5-12 (blue) experiments.