
Figures & data
Fig. 1 (a) Fraction of lake cover (%) in CNRM-CM5. (b) Location and depth of the 200 selected lakes for the ARC-Lake database.
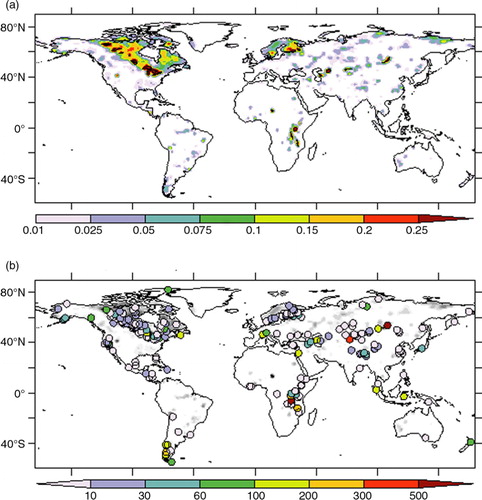
Fig. 2 Impact of depth limitation on the mean annual cycle of surface temperature: (a) Lake Superior, (b) Lake Baikal, (c) Lake Malawi, (d) Lake Buenos-Aires, (e) map of biases difference XPR minus XPD and (f) map of RMSEs difference XPR minus XPD.
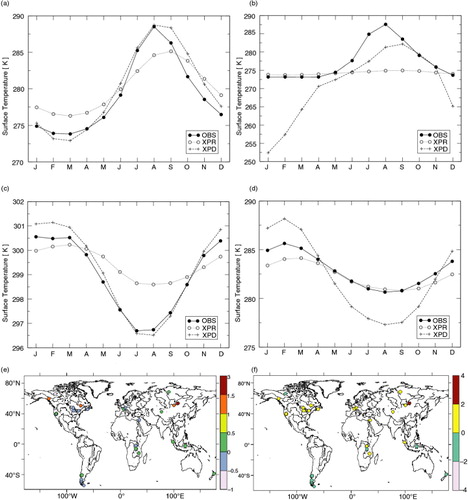
Table 1. Summary of offline calibration experiments
Table 2. Comparison of seasonal biases for XPR and XPD for four selected lakes
Fig. 3 Impact of ice albedo reduction on mean annual cycle of the surface temperature: (a) Lake Athabasca, (b) Lake Ngoring, (c) Lake Baikal, (d) map of reduction of thaw delay (days) for XPD minus XPA and (e) map of reduction of thaw delay as a function of height.
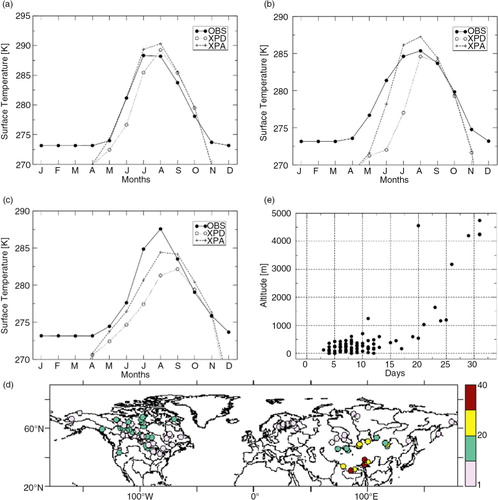
Fig. 4 Taylor diagram summarising the improved surface temperature results for experiments XPR, XPD, XPA and XPE.
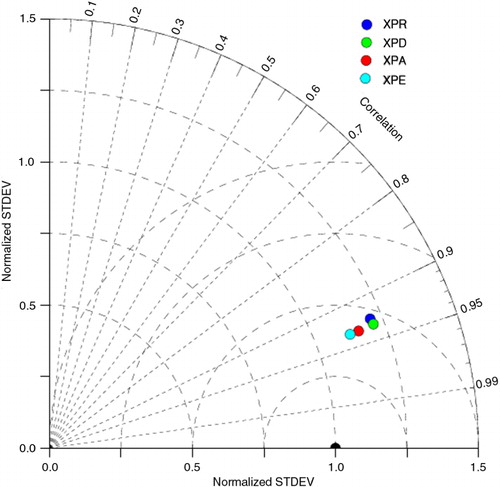
Fig. 5 Histogram of RMSE differences of surface temperatures XPE minus XPF for which skin temperature parameterisation has been turned off.
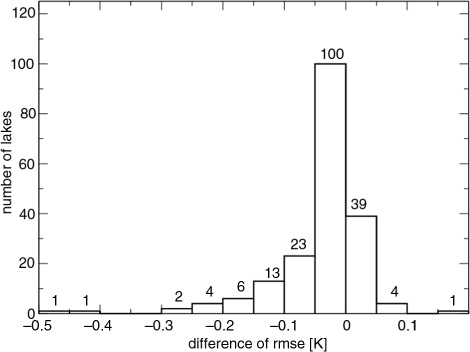
Fig. 6 Evaluation of Offline-FLake and Inline-FLake versus ARC-Lake data. Top: Mean annual surface temperature (°C) of lakes. Bottom: Number of days per year (%) for which each lake is frozen. Left panel: Offline-FLake – ARC-Lake. Right panel: Inline-FLake – ARC-Lake.
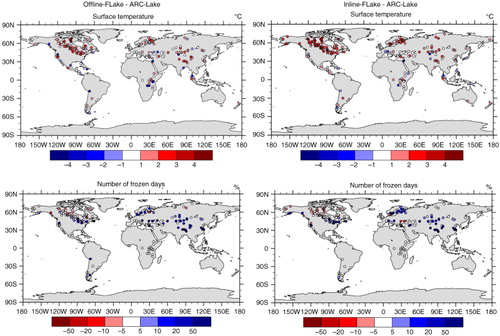
Fig. 7 Mean annual cycles of surface temperatures (°C) over 12 lakes whose characteristics are given in . Black line: ARC-Lake data; blue line: Offline-FLake; and red line: Inline-Flake.
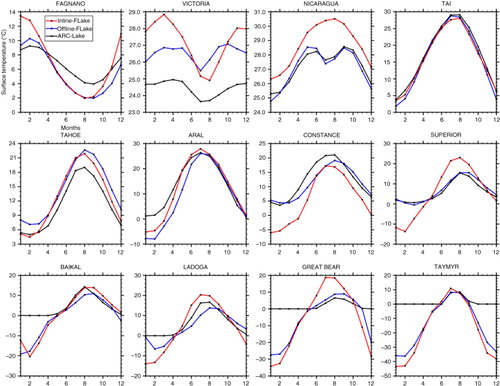
Table 3. Characteristics of lakes
Fig. 8 Seasonal mean differences with and without FLake (Inline-FLake – Inline-noFLake) of Albedo and surface temperatures (°C). Left panel: Surface albedo over lakes. Central panel: Surface temperature over lakes. Right panel: Total surface temperature.
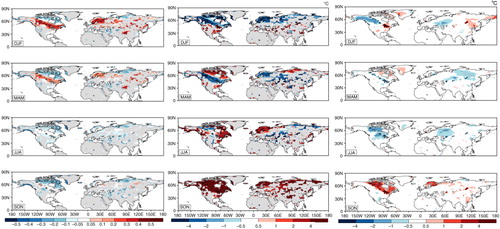
Fig. 9 Seasonal mean daily maximum 2-meter temperature (°C). Left panel: Inline-noFLake – CRU. Central panel: Inline-FLake – CRU. Right panel: Inline-FLake – Inline-noFLake. The grey-stippled areas on the right panel indicate a 95 % significance.
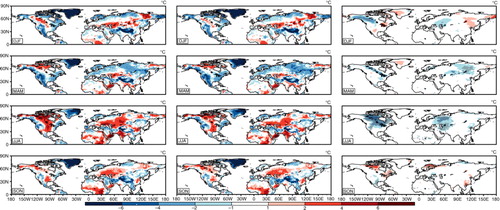
Fig. 10 Same as for daily minimum 2-m temperature.
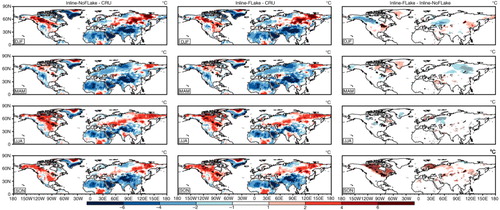
Fig. 11 Seasonal mean differences with and without FLake (Inline-FLake – Inline-noFLake) of specific humidity (103 kg/m3) on the left panel, latent heat flux (W/m−2) on the central panel and sensible heat flux (W/m−2) on the right panel. The grey-stippled areas indicate a 95 % significance.
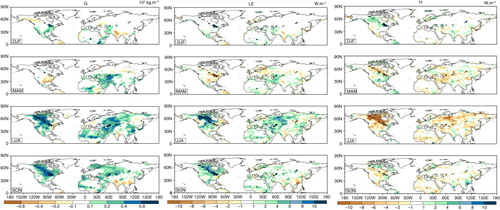
Fig. 12 Meridian and zonal slices of potential temperature (°C) and specific humidity (103 kg/m3) differences (Inline-Flake – Inline-noFLake) over the following three boxes: Canadian tundra (120°W–100°W/60°N–70°N), Canadian taiga (150°W–120°W/55°N–65°N) and Great Lakes (95°W–75°W/42°N–50°N). (a) Winter (DJF); (b) summer (JJA); and (c) autumn (SON).
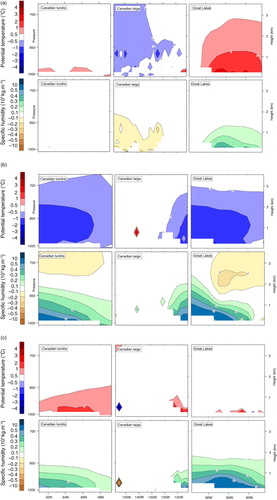
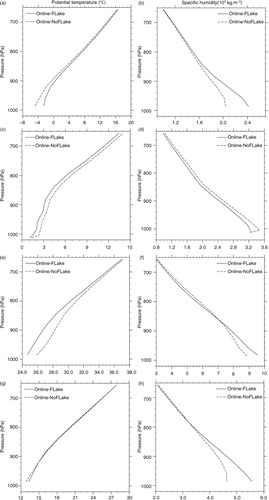
Fig. 13 Typical vertical profiles of potential temperature (°C) (a, c, e, g) and specific humidity (103 kg.m−3) (b, d, f, h). (a) and (b) correspond to the winter (DJF) mean over Lake Michigan; (c) and (d) are the winter means (DJF) over south Alaska (145°W–130°W/56°N–61°N); (e) and (f) are the summer (JJA) mean over Lake Michigan; (g) and (h) are the autumn (SON) means over Lake Michigan.
B.1. Description of the 200 lakes used for the evaluation