Figures & data
Fig. 1 Geographic location of the two sites used for measurements of the atmospheric electric field: Amieira (AMI) and Parque Solar (PS). The lake meteorological station (Alqueva-Montante) is also depicted. Constant surface elevation lines (200 m) are added in the map.
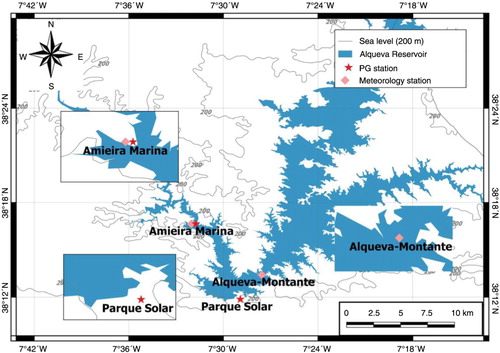
Fig. 2 Potential gradient distributions for the raw data in the two study locations: (a) Amieira (AMI) and (b) Parque Solar (PS). Measurements acquired during the 17 observed days of fair weather (11 June to 29 July 2014) in reference to the Alqueva-Montante floating platform.
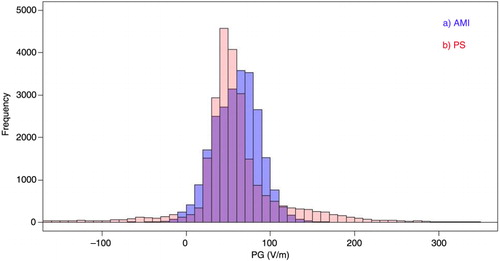
Table 1. Mean, median, standard deviation (Std.), skewness and kurtosis for the PG measurements acquired during the 17 fair-weather days from 11 June to 29 July 2014
Fig. 3 Lomb–Scargle periodograms in logarithmic scale for PG at (a) AMI and (b) PS. Measurements acquired during the 17 observed days of fair weather (11 June to 29 July 2014) in reference to the Alqueva-Montante floating platform. The linear fits represent the asymptotic spectral behaviour for low periods retrieving the n-exponent (n=1.36 and 1.26 for AMI and PS, respectively). Dashed lines mark the diurnal and semi-diurnal peaks, as determined from solar radiation measurements.
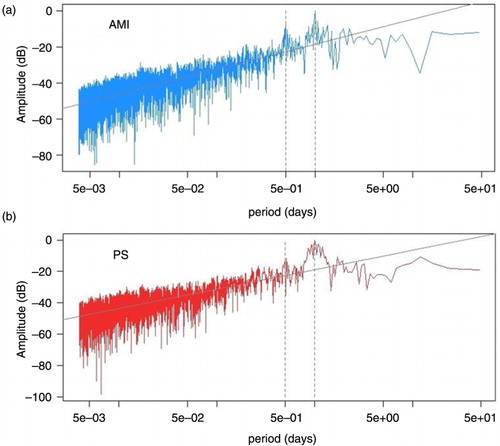
Fig. 4 Hourly mean diurnal variation of (a) potential gradient (V/m) at the two measuring locations, AMI and PS; (b) potential gradient difference (ΔPG, V/m) between AMI and PS. Up-ward and down-ward arrows represent the sunrise and sunset, respectively, and the two pointed head arrow mark the solar maximum. The two vertical dashed lines correspond to start and end of the lake breeze.
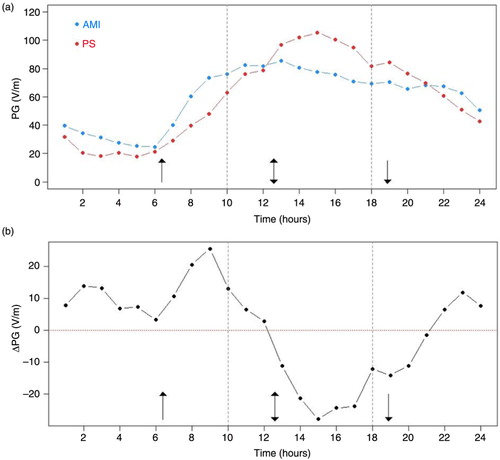
Fig. 5 (a) Number of occurrences of wind in AMI corresponding to southern directions (SE and SE) revealing the effect of the lake breeze. (b) Boxplot representation of the wind direction dependence of the ΔPG (V/m) between AMI and PS: NW, NE, SE and SW.
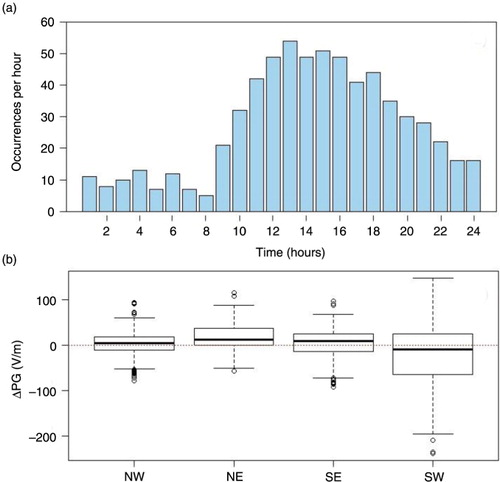
Table 2. Mean, median, standard deviation (Std.), skewness, kurtosis, and number of measurements (N. M.) of ΔPG for the 17 fair-weather days
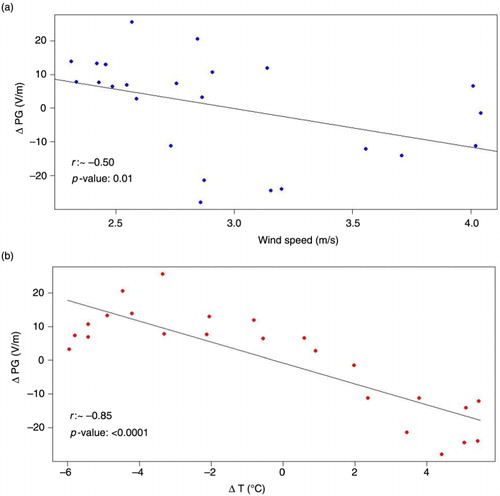
Fig. 6 Relation of the ΔPG (V/m) between AMI and PS: (a) the lake wind speed (m/s); (b) lake temperature difference between the surface (2 m height) and the interior (1 m deep). Both lake parameters were measured at Alqueva-Montante floating platform. Linear correlations between parameters are depicted through regression lines. The respective correlation coefficients (r) and the significant levels (p) are also depicted. Both lake parameters were measured at Alqueva-Montante floating platform.