Figures & data
Fig. 1. Cycling and effects of primary biological aerosol particles in the atmosphere and biosphere (adapted from Pöschl, Citation2005).
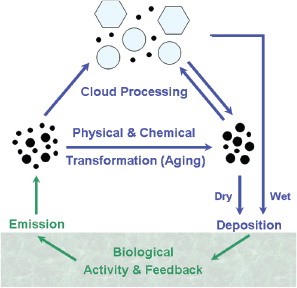
Table 1. Characteristic types of primary biological aerosol particles (PBAP)
Table 2. Taxonomic information on biological particles in air mentioned in the review
Fig. 2. Column density of bacterial tracer (106 m−2), simulated from estimated emissions for a set of ten ecosystems estimates (Burrows et al., Citation2009b).
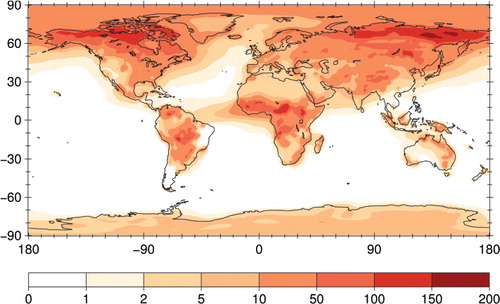
Fig. 3. Fungal spores with and without coating by secondary organic aerosol (dark gray envelope in left panel). Electron micrographs of aerosol filter samples from pristine tropical rainforest air in the Amazon (CitationPöschl et al., 2010), (Reproduced with permission from AAAS).
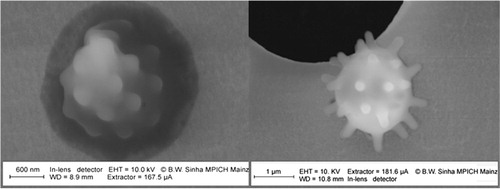
Table 3. Global emission estimates for different types of PBAP and size ranges of air particulate matter (PMx, x = upper limit of particle diameter; TSP = total suspended particulates)
Table 4. Characteristic magnitudes of the number and mass concentrations of PBAP in air over vegetated regions
Fig. 4. Characteristic time series and number size distribution of fluorescent biological aerosol particles (FBAPs) measured with an ultraviolet aerodynamic particle sizer (UV-APS) in central Europe (Mainz, Germany, October 2006). The peaks at ~1.5, ~3 and ~13 µm can be attributed to bacteria, fungal spores, and pollen. N F,c is the number concentration of FBAPs, and N T,c is the number concentration of total aerosol particles with aerodynamic diameters D a>1 µm; dN F/dlogD a is the number size distribution function of FBAPs (CitationHuffman et al., 2010).
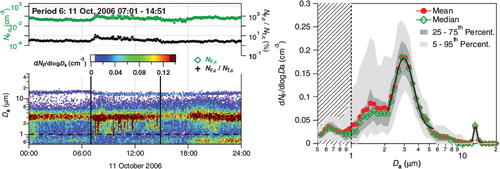
Table 5. Compilation of laboratory measurements of the hygroscopic properties of biological particles (n.a.=data not available)
Fig. 5. Ice nucleating number fraction f IN at the observed IN onset and maximum activity temperatures from the experiments listed in Table 6. For comparison, f IN data for immersion freezing on mineral dust (natural soil samples, median diameters of 0.2–1 µm) are included (M. Niemand, personal communication).
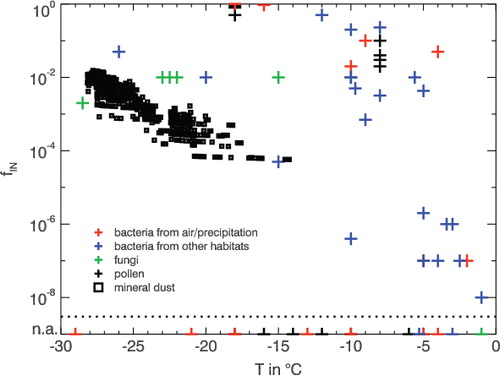
Table 6. Compilation of laboratory measurements of the IN properties of biological particles (n.a.=data not available)