Figures & data
Fig. 1. Wetland distribution map based on GLWD (Lehner and Döll, Citation2004) used in VISIT model. Grid colour indicates the wetland fraction for each grid. For example, 50% (green) means that half of the surface in the grid is regarded as wetland. KRS and DEM denote the tower position at Karasevoe (58°15′N, 82°25′E) and Demyanskoe (59°47′N, 70°52′E), respectively.
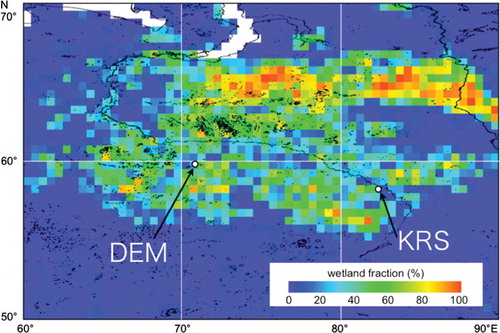
Fig. 2. A schematic diagram of the CH4 exchange scheme used in this study.
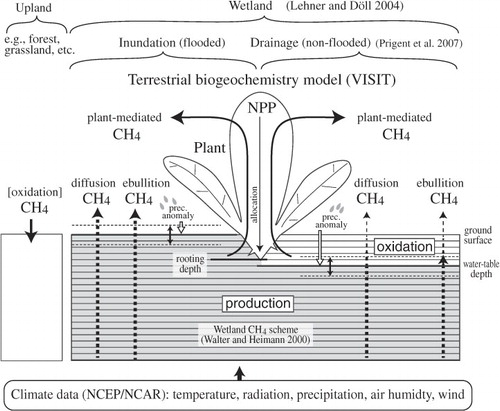
Fig. 3. Mean diurnal variation of CO2 and CH4 concentrations during summer (June, July and August) at KRS and DEM. The data from high inlet were annually averaged. Vertical dotted lines indicate the mean time of sunrise and sunset. Every 12 h, all three measurements for the hour were of standard gases; thus, there are no data at 8:30 LST and 20:30 LST.
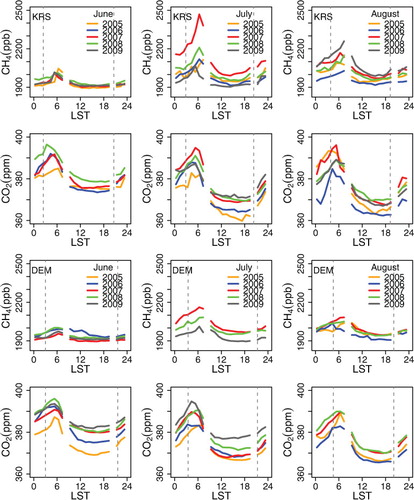
Fig. 4. Relationship between ΔCO2 and ΔCH4 during summer at KRS (upper panels) and DEM (lower panels). ΔCO2 and ΔCH4 are defined as the measured concentration difference between the concentration at 21:30 LST and the accumulated concentration in the early morning the next day at 4:30 LST. Dotted lines indicate expected relationship from environment in CO2-flux:CH4-flux = 100:1, 200:1 and 400:1.
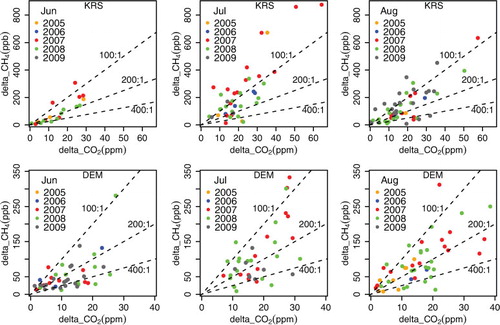
Fig. 5. Box-and-whisker diagrams of daily CH4 flux calculated with nocturnal CO2 and CH4 accumulation over an area (±3° latitude, ±1° longitude) around (a) KRS and (b) DEM. The diagrams are defined as follows: the median is the thick line in the box; the bottom and top of the box are the lower and upper quartiles, respectively; the whiskers extend to the most extreme data point which is no more than one time the interquartile range from the box; individual outliers are shown as open circles outside the whiskers. Horizontal grey lines indicate regional means of fluxes from the wetlands (bogs, swamps and tundra) in the GISS model. Closed diamonds denote monthly CH4 flux simulated with VISIT model. Open (grey) diamonds denote monthly CH4 flux of high (low) response case for precipitation anomaly. The bottom figures show the number of calculated day for each month and year. It depends mostly on the number of the obtained data. No winter data are shown since there is almost no diurnal variation during winter (Sasakawa et al., Citation2010).
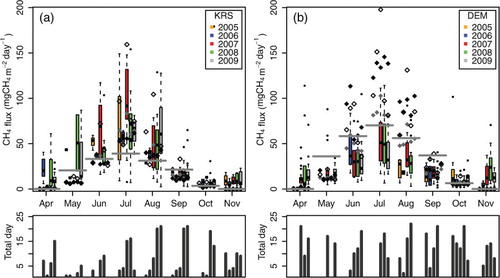
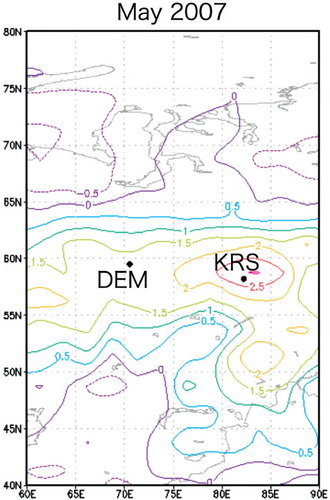
Fig. 6. Anomaly of precipitation rate (mm d−1) in May 2007 relative to the monthly average of the 1979–1998 period obtained from GPCP version 2.1 combined precipitation data set (Adler et al., Citation2003).