Figures & data
Fig. 1. Map of Ny-Ålesund and Austre Brøggerbreen (Svalbard) with 1) the Amundsen-Nobile Climate Change Tower, 2) Zeppelin atmospheric monitoring station and 3) the Snow Tray measurement site. Also included as black circles are the locations where snow samples for the Glacial Accumulation method were taken.
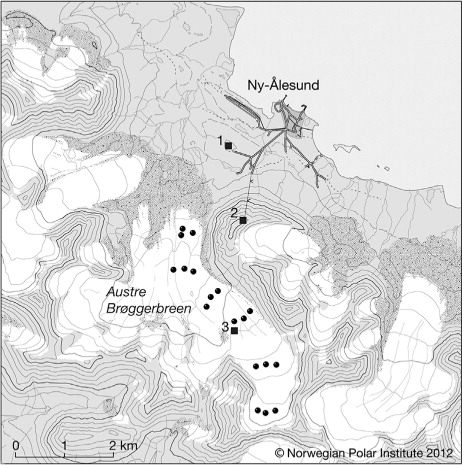
Table 1. Model inputs for the log normal distributed (LND) run based on figures provided in Teinilä et al. (Citation2003) and Bergin et al. (Citation1995). Given are the range of each size bin, the particle diameter (d p) at the middle of each size bin on the logarithmic scale and the individual ratio (R LND) between the size bins following a log normal distribution
Fig. 2. Dry deposition estimated from Snow Tray sampling at Austre Brøggerbreen: a) The calculated flux (F
tray) given at the end of each sampling period, where a negative number indicates dry deposition (hence, an atmospheric loss of
), b) The calculated total load of
in the trays, and c) the corresponding
concentration (c
NO3
) in the snow. Black and white dots indicate the paired zero and exposed samples, respectively, connected with a straight line for clear identification. Error bars indicate standard error of the measurements, and * indicates standard error calculated from only two data points. Precipitation events, wind speed and temperature measured by DNMI are given as gray bars or shaded areas in a), b) and c).
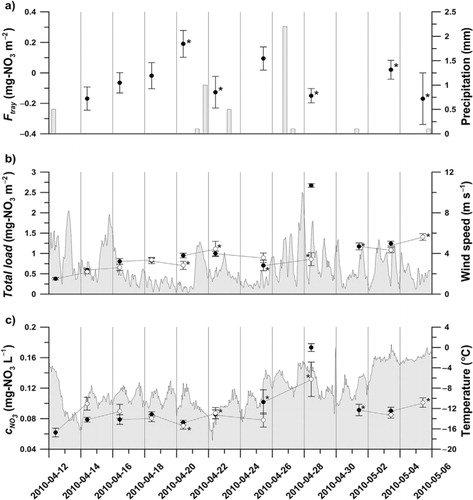
Table 2. Measured and modelled dry deposition fluxes, mg m−2, for the three different methods used
Fig. 3. The load of in the snow pack (F
tot), calculated from snow cores capturing the entire winter accumulation at Austre Brøggerbreen, plotted versus the snow accumulation (z
SWE). Also given is the linear regression (solid line) for the data where the intercept with the y-axis indicates
addition due to dry deposition (F
d). Further, the corresponding 95% confidence interval for the linear model (broken line) is given as well as the equation for the regression line (± 1 S.E.).
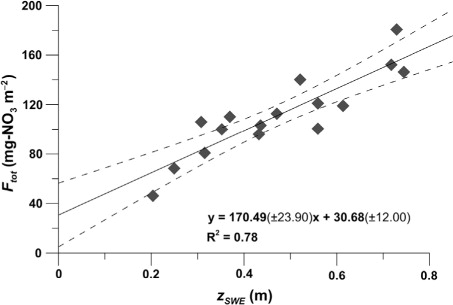
Table 4. Winter snow accumulation on Austre Brøggerbreen for Winter 2009–2010 and the corresponding load of NO3 calculated from the data given in
Fig. 4. Measured concentrations of a) gaseous nitrate acid () and b) particulate nitrate (
) measured by NILU at the Zeppelin atmospheric monitoring station. Gaps in the a) and b) indicates missing data.
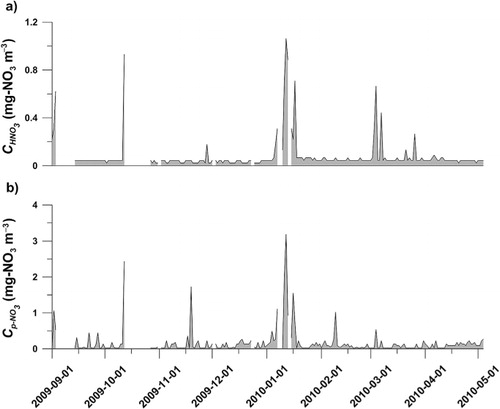
Fig. 5. Modelled dry deposition of HNO3 during Winter 2009–2010: a) daily average deposition velocity () given by the model, b) daily average dry deposition of HNO3 (F
HNO3
) calculated from the C
HNO3
(a) and
, and c) the accumulated dry deposition (Σ
) giving the total deposition for the winter season. The shaded areas in a) and c) indicate standard error of the estimates, while the shaded area in b) resembles the integrated area for the estimated dry deposition.
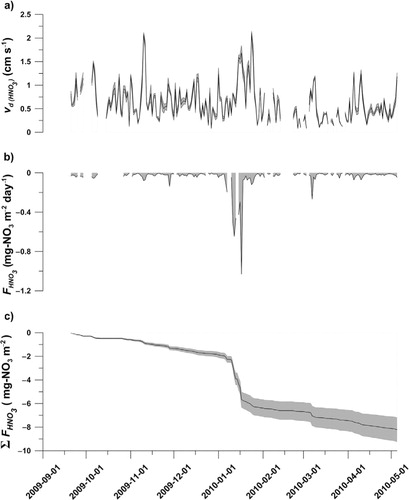
Fig. 6. Average daily atmospheric stability as the Richardson number, Ri m, calculated from the CCT data. Positive numbers indicates stable boundary layer conditions and negative numbers indicate unstable conditions.
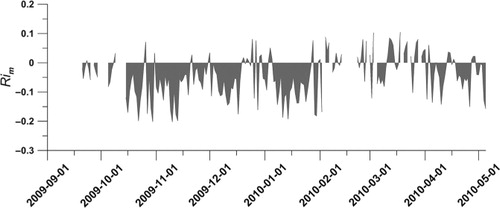
Fig. 7. Particulate median dry deposition velocities, , for all particle diameters, d
p, estimated by the model and the corresponding median when only stable (R
i>0) or unstable (R
i<0) atmospheric conditions have been included (lower and upper dashed lines). The aerosol volume fraction, R
DMPS, measured by the Differential Mobility Particle Sizer (DMPS) at the Zeppelin atmospheric monitoring station, and the ratio, R
LND, between the five lognormal distributed (LND) size bins used to evaluate dry deposition of supermicron particles are also given. Shaded areas indicate 1st and 3rd quartiles of modelled output and measured R
DMPS.
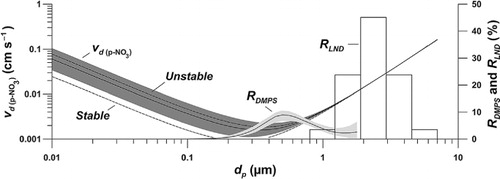
Fig. 8. Dry deposition of p-NO3 during Winter 2009–2010 for the two model runs, using the range estimated from the Differential Mobility Particle Sizer (DMPS) or the lognormal distributed (LND) range among supermicron particles: a) daily average deposition velocity () for the two model runs, b) daily average dry deposition of p-NO3 (
) calculated from the C
p-NO3
(b) and v
d
(p-NO3), and c) the accumulated dry deposition (Σ
) giving the total deposition for the winter season. The shaded areas in a) and c) indicate standard error of the estimates, while the shaded area in b) resembles the integrated area for the estimated dry deposition.
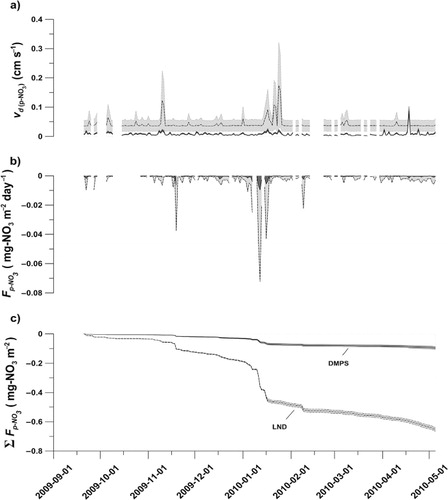
Table 3. Summary of model output for the roughness length z 0, friction velocity u *, Richardson number Ri m, aerodynamic resistance r a, quasi laminar boundary layer resistance r b for gaseous nitric acid HNO3, and particulate nitrate p-NO3, together with deposition velocities v d
Table 5. Total dry deposition of NO3 − at Austre Brøggerbreen calculated from the three different methods, with±1 SE indicated. The corresponding percentage of total deposition based on the measured 780.54±156.54 kg () deposition on Austre Brøggerbreen is also given