Figures & data
Fig. 1. Geographical distribution of sampling sites and Urumqi station, derived from database of the International Atomic Energy Agency–World Meteorological Organization (IAEA–WMO) Global Network of Isotopes in Precipitation (GNIP). The inset is schematic representation of the moisture-controlling weather patterns and rainfall regime in the study area (after Araguás-Araguás et al., Citation1998).
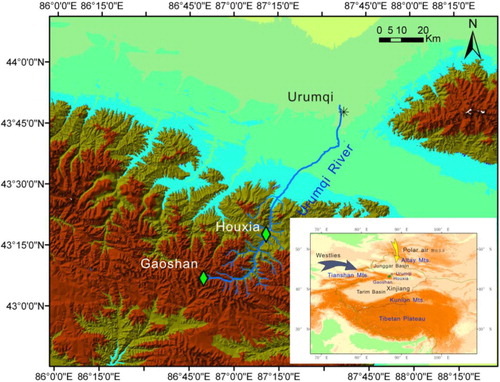
Table 1. Summary of samples for isotopes in precipitation
Fig. 2. Sub-cloud evaporation: change of the d-excess with increasing evaporated fraction estimated at Gaoshan, Houxia and Urumqi stations. The numbers near the triangle symbol represent the month (4 – April, 5 – May, etc.).
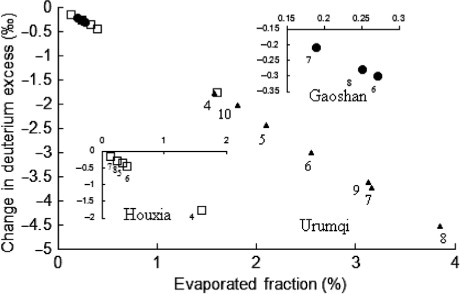
Table 2. Change of d-excess with increasing evaporated fraction
Table 3. Results of monthly recycling fraction at Gaoshan, Houxia and Urumqi stations
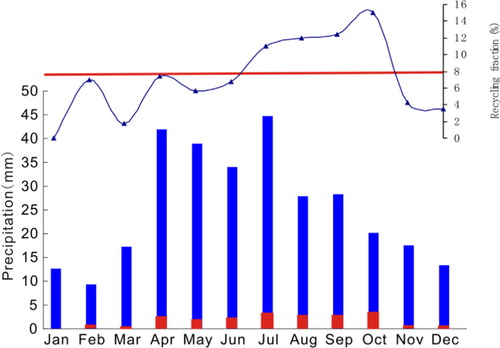
Fig. 3. Recycling fraction in precipitation and precipitation amount at Urumqi station. The blue column is precipitation amount and the red column represents the recycling amount during each month. The curve is the recycling fraction during each month and the red line is a weighted average recycling fraction with the value of 8%.