406
Views
2
CrossRef citations to date
0
Altmetric
Original Research Articles

Unravelling the land source: an investigation of the processes contributing to the oceanic input of DIC and alkalinity

&
Article: 19683 | Received 06 Sep 2012, Accepted 05 Mar 2013, Published online: 25 Apr 2013

Figures & data

Fig. 1 Reservoirs and processes within the marine nitrogen cycle. The arrows represent exchange processes and the numbers are the associated alkalinity effects.

Fig. 1 Reservoirs and processes within the marine nitrogen cycle. The arrows represent exchange processes and the numbers are the associated alkalinity effects.

Fig. 2 Simplified representation of the marine nitrogen cycle. The ammonium is assumed instantly nitrified. The numbers coupled to the arrows are the alkalinity effect associated with each exchange process.

Fig. 2 Simplified representation of the marine nitrogen cycle. The ammonium is assumed instantly nitrified. The numbers coupled to the arrows are the alkalinity effect associated with each exchange process.

Fig. 3 Simplified representation of the marine nitrogen cycle. The ammonium is assumed to be nitrified as in . Furthermore, the organic nitrogen reservoir is assumed small compared to the nitrate reservoir.

Fig. 3 Simplified representation of the marine nitrogen cycle. The ammonium is assumed to be nitrified as in Fig. 2. Furthermore, the organic nitrogen reservoir is assumed small compared to the nitrate reservoir.

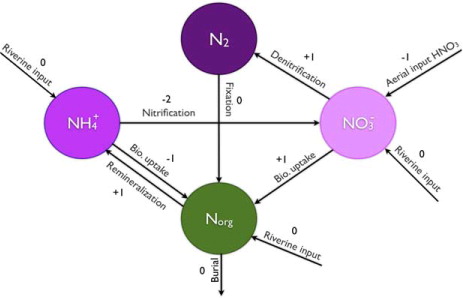
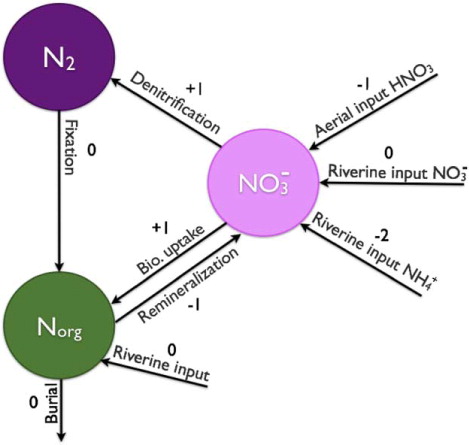
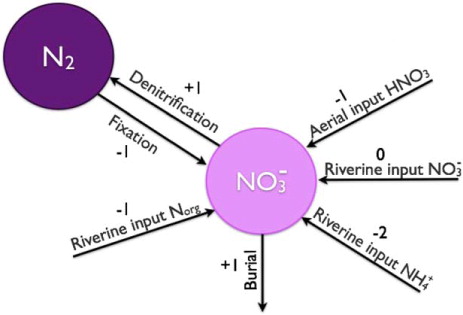
Table 1. Effect of the different processes on DIC and alkalinity. Units of moles for DIC and equivalents for alkalinity

Table 2. Riverine fluxes of different ions, Particulate and Dissolved Organic Carbon (POC, DOC) and Total Dissolved Nitrogen (TDN)

Table 3. Riverine fluxes of dissolved species due to different processes. Also included are ocean floor burial of pyrite and organic carbon

Table 4. Total river fluxes of DIC derived from different processes together with the internal and external components. Also shown are examples of models that include a certain process

Table 5. Alkalinity fluxes due to different processes together with models that include a certain process