Figures & data
Table 1. Applied instruments on the Marburg Ground Truth and Profiling Station
Fig. 1 Synoptic weather regimes during the three fog events referring to Hess and Brezowsky (Citation1977) and James (Citation2007) (DWD, Citation2011): (a) first fog event: 26–27 October 2011; (b) second fog event: 31 October 2011–1 November 2011; (c) third fog event: 13–14 November 2011. Left column: 500 hPa level, right column: surface pressure level.
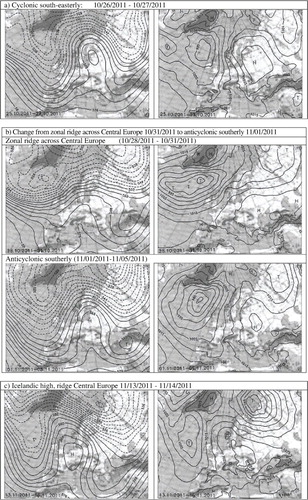
Fig. 2 Flowchart of the statistical approach for the detection and statistical proof of change point (CP) in double sum curves of measurement series.
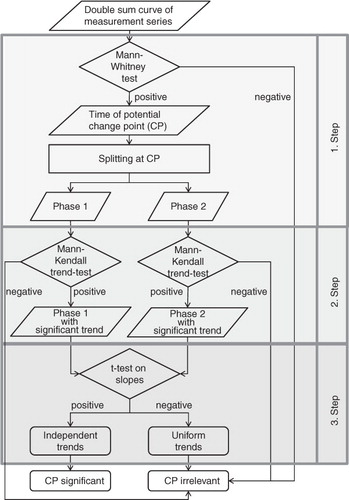
Table 2. Found potential change points (CP) of the three fog events from the homogeneity test of Mann–Whitney for the cumulative sum of VIS, LWC, N t, r c and r mean
Table 3. Two-sided t-test on the slopes of the phases regarding the microphysical parameters and VIS from the three measured fog events
Fig. 3 Measured data during third fog event: 13–14 November 2011. (a) Horizontal visibility (VIS); (b) microphysical properties: liquid water content (LWC), total number of droplets per cm3 (N t), mean droplet radius (r mean), modal droplet radius (r c); (c) meteorological properties: temperature (T), relative humidity (RH), wind speed; (d) cloud ceilings. The first and last vertical line represent the time when VIS is the first and last time below 1 km during the fog event. The other two vertical lines signify the break points determined by the statistical approach.
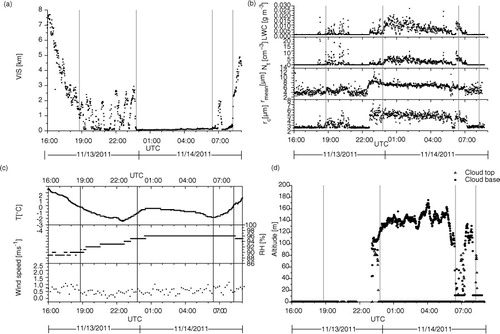
Table 4. Overview of the microphysical properties of the three fog measurements differentiated by evolutionary stages liquid water content (LWC), total amount of droplets N t, arithmetic mean of radius r mean, modal value of radius r c, minimum value of radius r min, maximum value of radius r max, range between minimum and maximum value within a drop size spectrum
Fig. 4 Measured data during first fog event: 26–27 October 2011. (a) Horizontal visibility (VIS); (b) microphysical properties: liquid water content (LWC), total number of droplets per cm3 (N t), mean droplet radius (r mean), modal droplet radius (r c); (c) meteorological properties: temperature (T), relative humidity (RH), wind speed; (d) cloud ceilings. The first and last vertical line represent the time when VIS is the first and last time below 1 km during the fog event. The other two vertical lines signify the change point (CP) determined by the statistical approach.
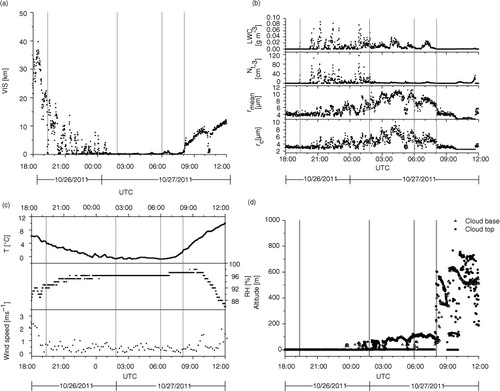
Fig. 5 Measured data during second fog event: 31 October 2011–1 November 2011. (a) Horizontal visibility (VIS); (b) microphysical properties: liquid water content (LWC), total number of droplets per cm3 (N t), mean droplet radius (r mean), modal droplet radius (r c); (c) meteorological properties: temperature (T), relative humidity (RH), wind speed, wind direction; (d) cloud ceilings. The first and last vertical line represent the time when VIS is the first and last time below 1 km during the fog event. The other two vertical lines signify the break points determined by the statistical approach.
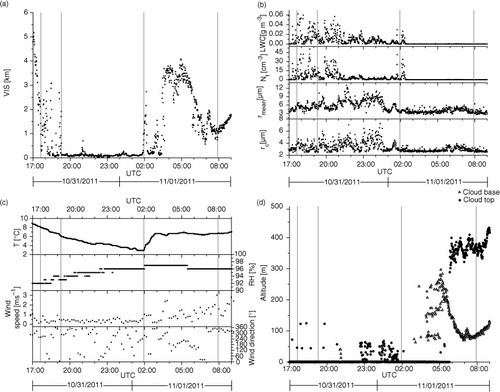
Fig. 6 Horizontal visibility (VIS) as a function of (a) liquid water content (LWC) and (b) total number of droplets per cm3 for all three fog events.
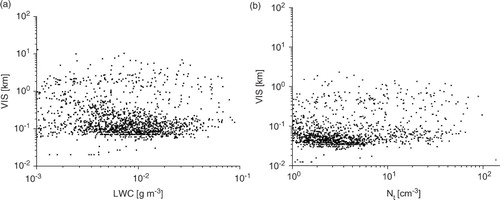
Table 5. Comparison of the measured microphysical parameters (LWC, N t, r c) with values from literature compiled in Maier et al. (Citation2012)