Figures & data
Fig. 1. Δ14CO2 trends in background air over Europe 2000–2012. (a) Individual data from Jungfraujoch with 1σ error bars together with a harmonic fit curve calculated through the monthly mean data; the outlier in spring 2000 is a contaminated sample and is not included in the monthly mean values of , (b) Schauinsland monthly means in comparison with the Jungfraujoch fit curve from (a) and May–August (spring and summer) mean values with 1σ standard deviation of the four monthly values.
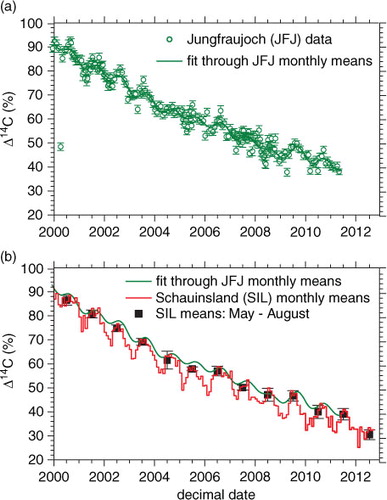
Table 1. Monthly mean Δ14CO2 data from Jungfraujoch and Schauinsland as well as monthly values from the fitted curve through Jungfraujoch data. Last column gives spring and summer mean values (including 1 sigma standard deviations of the monthly averaged data).