Figures & data
Table 1 Results from concentration and isotope measurements
Fig. 1 Back trajectories (BTs) of sampled air, as determined by HYSPLIT4 model. The arrows are describing the path of the air mass BTs and the dotted ellipses are indicating the area where it was last in contact with the ground (i.e. in the boundary layer). The BT 3 contact region is described by the entire arrow (dotted margins).
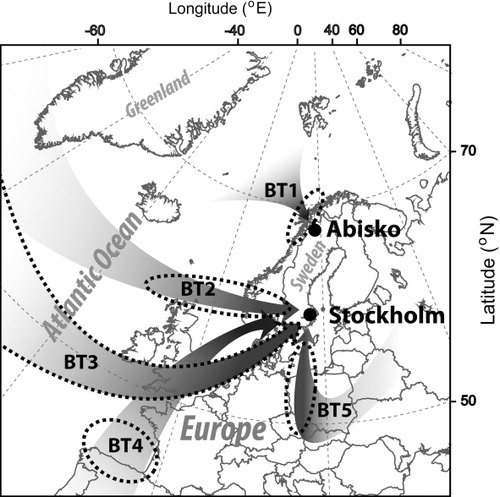
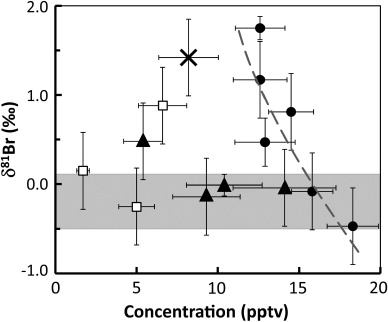
Fig. 2 Methyl bromide isotope composition as a function of concentration for Stockholm free air (filled circles), Abisko free air (open squares), Abisko dry soil air (filled triangles) and Abisko damp-soil air (cross). A logarithmic regression line (dashed, grey) shows the enrichment in δ81Br as the CH3Br concentration decreased in the Stockholm free air. The grey-shaded area indicates the lowest values found throughout both field campaigns and indicates a range of suggested background composition.