Figures & data
Table 1. Number of profiles satisfactorily inverted during day- and night-time in the period 2008–2010.
Fig. 1 (a) Autumn–winter and (b) spring–summer mean vertical profiles for different optical properties at 532 nm during night-time at Granada. The number of lidar ratio (LR) measurements available in each altitude has been indicated in parenthesis. Exponential fits (red lines) to the mean extinction profiles and fit parameters are given in addition. H and b denote height and scale height (km), respectively.
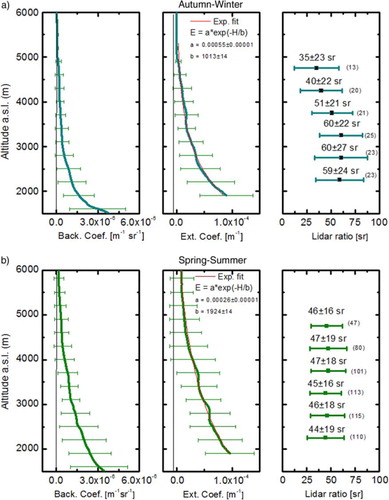
Fig. 2 (a) Autumn–winter and (b) spring–summer mean backscatter profiles at 355, 532 and 1064 nm for day-time measurements. Mean β-AE (355–532 nm) in autumn–winter (c) and spring–summer (d).
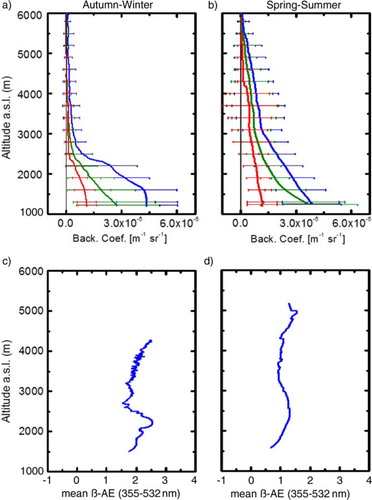
Fig. 3 PBL and residual layer heights (black circles) and the top altitude of lofted layers (coloured circles) are reported for (a) day-time measurements and (b) night-time measurements during the period 2008–2010.
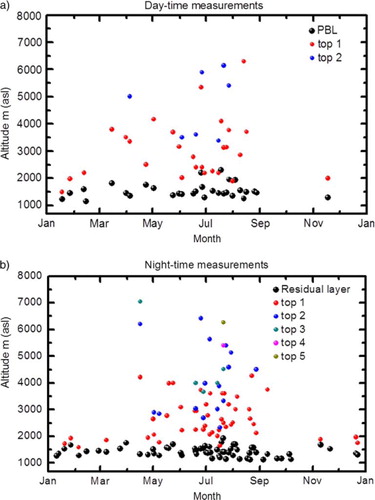
Fig. 4 Monthly mean β-AE (355–532 nm) retrieved in the residual layer (red circles) and in the FT (blue circles) from night-time lidar measurements. Number of Saharan dust events in coincident with lidar measurements is also shown (green circles).
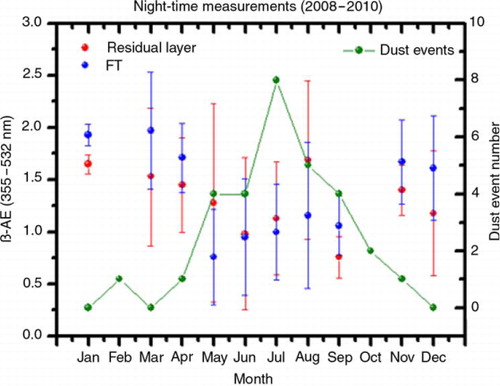
Fig. 5 Frequency distribution of β-AE for residual layer and FT during spring–summer and autumn–winter.
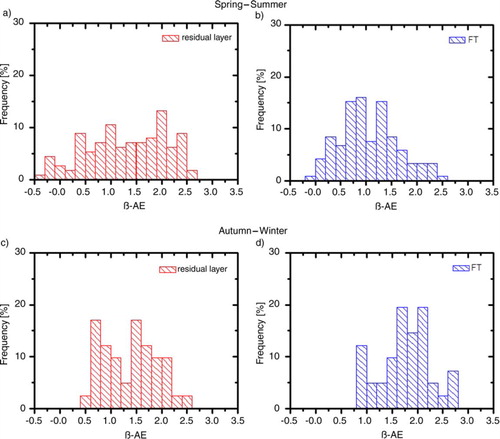
Fig. 6 Monthly mean β-AE (355–532 nm) retrieved in the PBL (red circles) and in the FT (blue circles) from day-time lidar measurements. Number of Saharan dust events in coincident with lidar measurements is also shown (green circles).
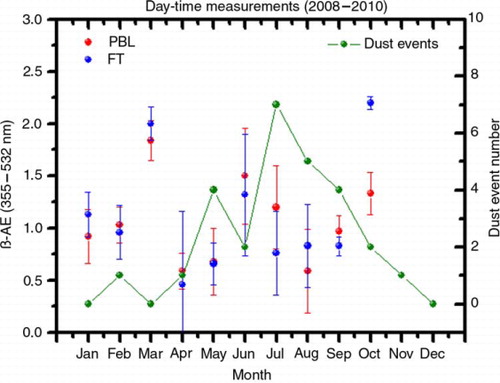
Fig. 7 (a) Monthly mean LR at 532 nm retrieved from night lidar measurements over 3 years and (b) frequency distribution of LR at 532 nm.
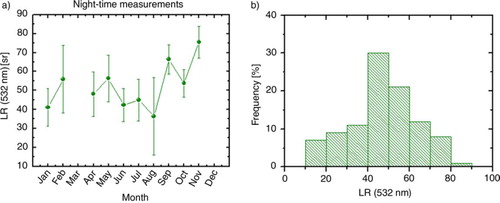
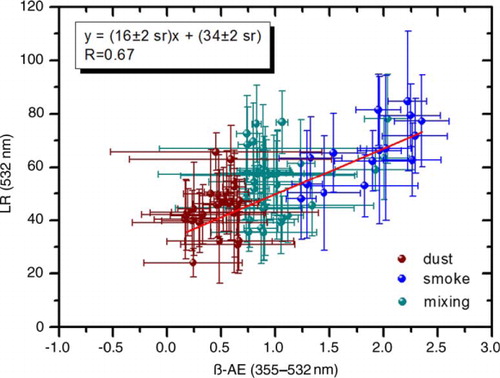
Fig. 8 β-AE (355–532 nm) versus LR at 532 nm in the FT. Dust, smoke and mixing particles have been identified in the plot with brown, blue and green colours, respectively.