Figures & data
Fig. 1 Map showing the location of the sampling site of Morogoro, Tanzania.
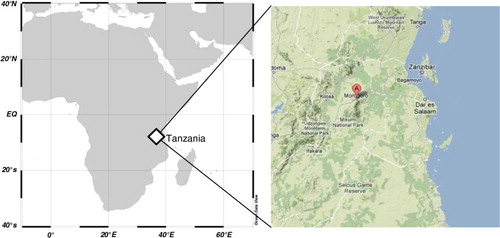
Fig. 2 Typical examples of 5-day backward air mass trajectories arriving at Morogoro during the May–August 2011 sampling period.
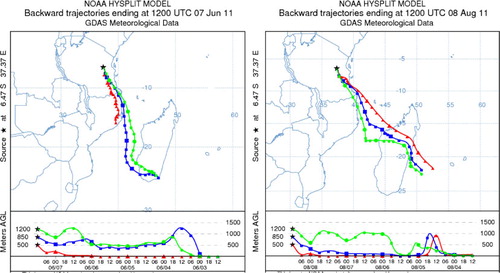
Fig. 3 Trends of aerosol mass concentrations (µg m−3) in PM2.5 and PM10 during the May–August 2011 sampling period at Morogoro.
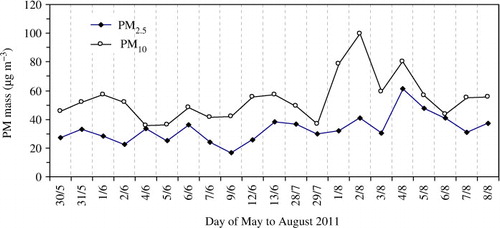
Table 1. Concentrations of TC and TN (µg m−3), their isotope ratios (‰), TC/TN and TC/PM (%) in PM2.5 from Morogoro, Tanzania (n=21)
Table 2. Concentrations of TC and TN (µg m−3), their isotope ratios (‰), TC/TN and TC/PM (%) in PM10 from Morogoro, Tanzania (n=21)
Table 3. Isotope ratios (‰) of carbon and nitrogen in the fine and coarse fractions of Morogoro, Tanzania, during 2011 wet and dry season campaigns
Fig. 4 Temporal variation of TC and δ13C in (a) PM2.5 and (b) PM10 during the May–August 2011 sampling period at Morogoro.
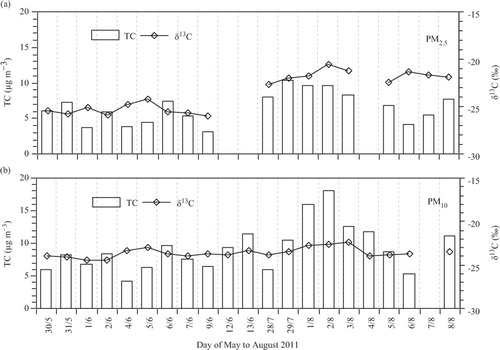
Fig. 5 Relation between TC with levoglucosan and nss-K+ in PM2.5 (a, b) and PM10 (c, d) during the sampling period.
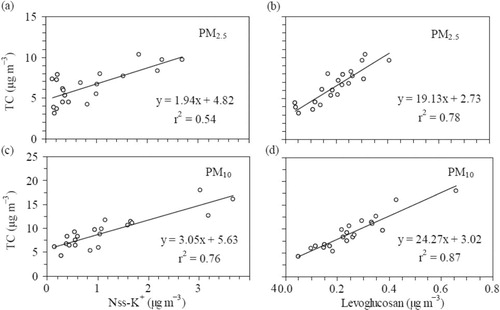
Fig. 6 Temporal variation of TN and δ15N in (a) PM2.5 and (b) PM10 during the May–August 2011 sampling period at Morogoro.
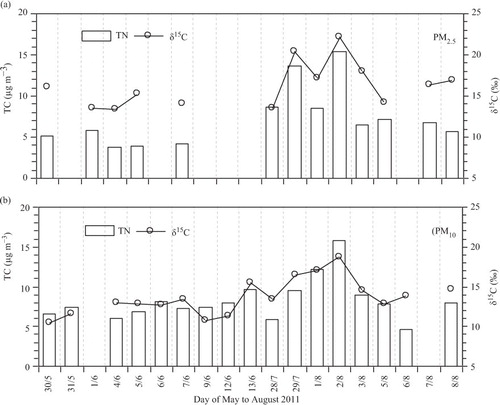
Fig. 7 Relation between -N,
-N and (
+
)-N with TN in (a) PM2.5 and (b) PM10 during the sampling period.
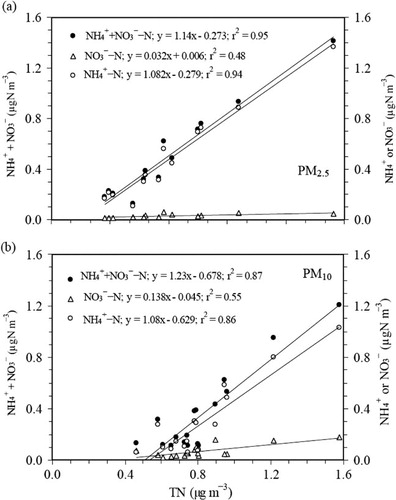
Fig. 8 Linear relation between δ13C of TC with nss-K+ and levoglucosan in (a, b) PM2.5 and (c, d) PM10 during the sampling period in tropical aerosols from Tanzania.
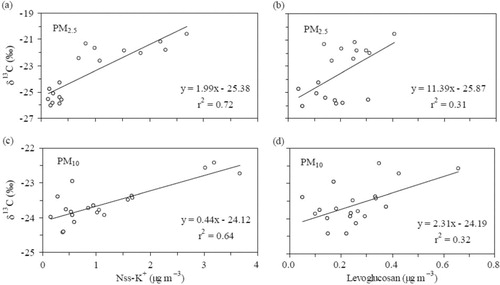
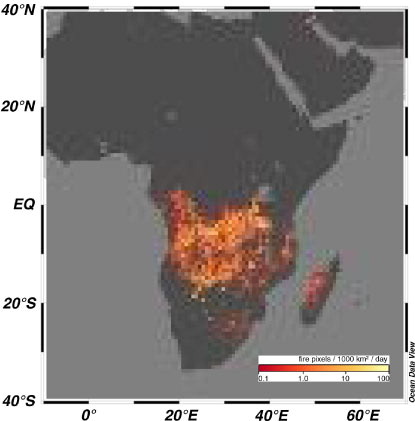
Fig. 9 Biomass burning active fire spots detected by MODIS satellite images (from NASA website) over southern and eastern Africa and Madagascar in July 2011.