
Figures & data
Fig. 1 Map of study locations: Patiala, Hisar and Kanpur in the Indo-Gangetic Plain (shown as yellow shaded area), at Barapani near Shillong in NE-Himalaya and at Ahmedabad and Mt Abu in semi-arid western India. MODIS derived fire-counts (plotted on the right) during the paddy- and wheat-residue burning period in the source region; sampling site at Patiala (shown by open star) is located downwind of major field-fires.
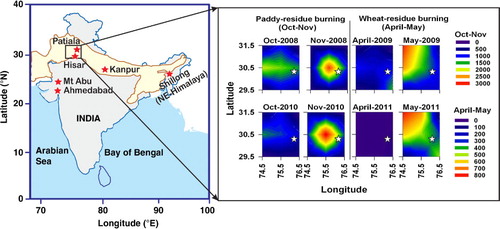
Table 1. Concentrations of carbonaceous species and characteristic ratios (Av±sd given in parenthesis) from biomass burning emissions and fossil-fuel combustion in the Indo-Gangetic Plain (IGP)
Fig. 2 Temporal variability in PM2.5 and mass fractions of OC, EC and nss-K+ associated with different emissions from source region (Patiala, Fig. 1) in the Indo-Gangetic Plain. The nss-K+=K+ aerosol – 0.037*Na+ aerosol; where K+/Na+ mass ratio of 0.037 is used for sea-salt contribution of K+ (Keene et al., 1986).
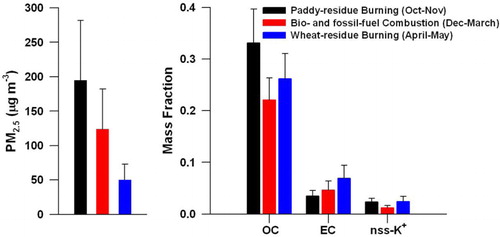
Fig. 3 Scatter plots of (a) EC vs. OC; (b) OC vs. non-sea-salt: nss-K+; and (c) OC vs. WSOC during different emissions in the IGP.
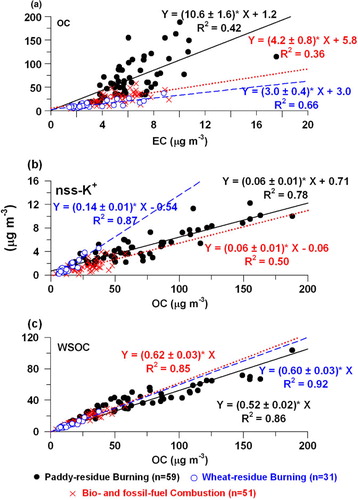
Fig. 4 Cross plots of PAH isomers showing distinct differences for the biomass burning emission vis-à-vis fossil-fuel combustion in the IGP: (a) FLA/(FLA+PYR; 4-ring on X-axis) vs. ANTH/(ANTH+PHEN; 3-ring on Y-axis); and (b) FLA/(FLA+PYR; 4-ring on X-axis) vs. IcdP/(IcdP+BghiP; 6-ring on Y-axis). Other data source: wood-fuel burning (Bari et al., Citation2009); (Vehicular+Coal) combustion (Sharma et al., Citation2008); vehicular emission (Khillare et al., Citation2005a, Citationb; Rajput and Lakhani, Citation2008); coal combustion (Kirton et al., Citation1991; Khalili et al., Citation1995; Li et al., Citation2010); savanna fire (Masclet et al., Citation1995).
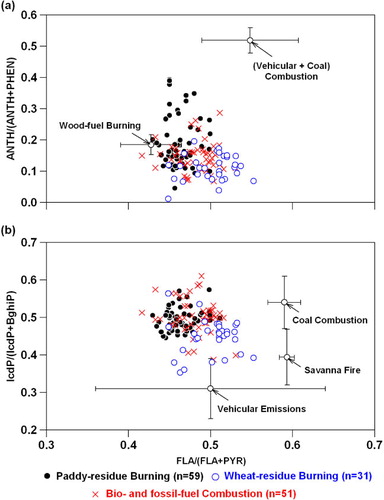
Table 2. Spatial distribution of OC/EC ratio in ambient aerosols from the Indo-Gangetic Plain (IGP) and different locations during wintertime (December–March)
Table 3. Emission budget of carbonaceous species from post-harvest agricultural-waste burning in the Indo-Gangetic Plain (IGP)
Fig. 5 Emission budgets of aerosol OC (primary) and EC from different biomass burning over the globe. Our data put together with a recent emission inventory suggest that OC and EC produced from agricultural-waste burning in the IGP (Northern India; shown as inset) contributes to ~22% [primary OC: 252±34 Gg/y] and 21% [EC: 59±2 Gg/y], respectively, on the global agricultural-waste burning emission scale.
![Fig. 5 Emission budgets of aerosol OC (primary) and EC from different biomass burning over the globe. Our data put together with a recent emission inventory suggest that OC and EC produced from agricultural-waste burning in the IGP (Northern India; shown as inset) contributes to ~22% [primary OC: 252±34 Gg/y] and 21% [EC: 59±2 Gg/y], respectively, on the global agricultural-waste burning emission scale.](/cms/asset/c3aa46ac-dfbe-4265-bd33-0e34d53afaca/zelb_a_11817287_f0005_ob.jpg)