Figures & data
Fig. 1 Position of Ny-Ålesund, Sodankylä and NP-35 in March/April 2008.
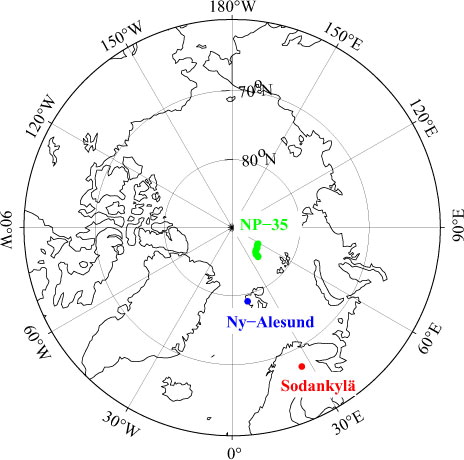
Table 1. Number and wavelength range of the interference filters in the sun photometer types SP2H, SP1A and PFR
Fig. 2 Cluster allocation of ensemble trajectories at all heights (850, 700 and 500 hPa) for Ny-Ålesund 1995–2008.
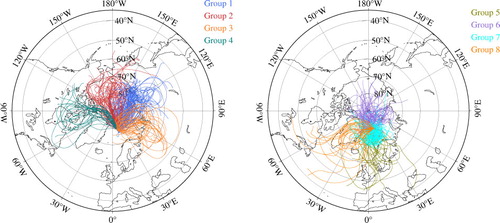
Fig. 3 (a) Mean values and standard deviation of τ 500nm and α and (b) number of hourly mean AOD in different trajectory groups from Ny-Ålesund 1995–2008. Seasonal separation: spring – red; summer – green; autumn – blue.
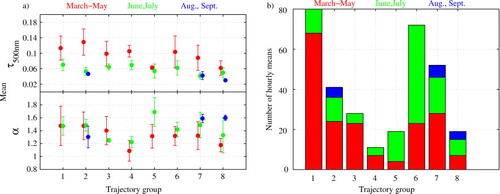
Fig. 4 Cluster allocation of ensemble trajectories at all heights (850, 700 and 500 hPa) for Sodankylä 2004–2007.
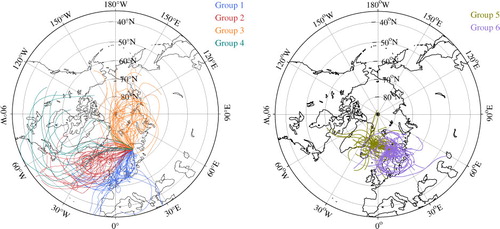
Fig. 5 (a) Mean values and standard deviation of τ 500nm and α and (b) number of hourly mean AOD in different trajectory groups from Sodankylä 2004–2007. Seasonal separation: spring – red; summer – green; autumn – blue.
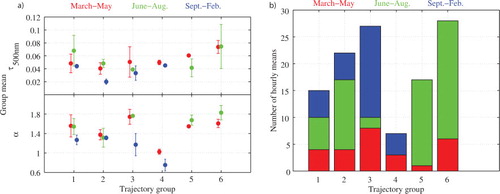
Fig. 6 (a) Clustering of the ensemble trajectories at all heights (850, 700, 500 hPa) from NP-35 between 14 March and 7 April, 2008, and (b) hourly mean of τ 500nm and α in the different trajectory groups and the group mean of τ 500nm and α.
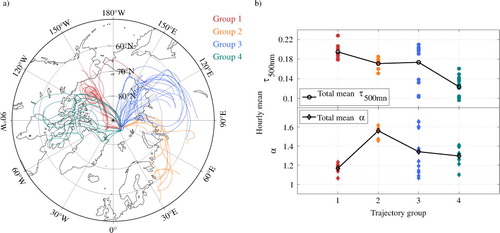
Fig. 7 Monthly means of τ 500nm and α in Ny-Ålesund.
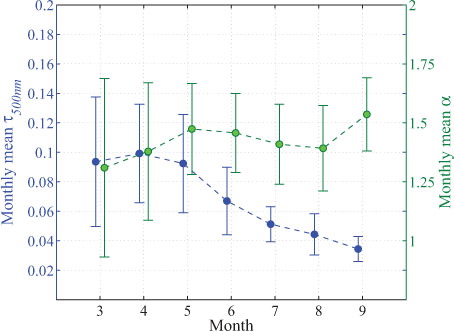
Fig. 8 Monthly means of τ 500nm and α in Sodankylä.
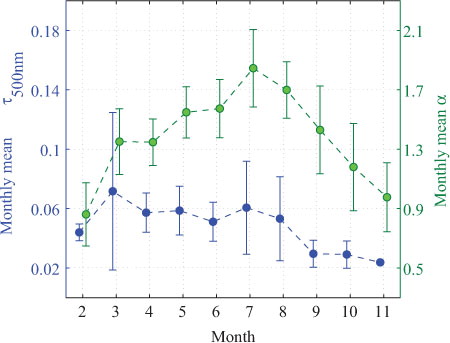
Fig. 9 Correlation between NAO-Index and monthly mean AOD in March (blue) and April (red) for Ny-Ålesund 1995–2008. Drawn are the monthly mean standard deviation and the linear regression of a) τ 500nm and b) α. The parameters of the regression, including the correlation coefficient and their confidence range, are shown in the legend.
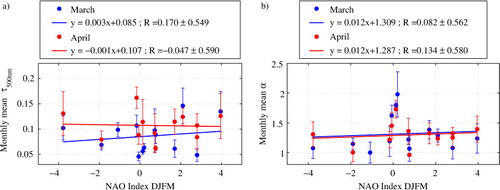
Fig. 10 First five EOF of mean sea-level pressure of three periods: left – December, January and February (1995–2008); middle – March (1995–2008); right – April (1995–2008) and their variance in %. The white star marks the position of Ny-Ålesund, respectively Spitsbergen.
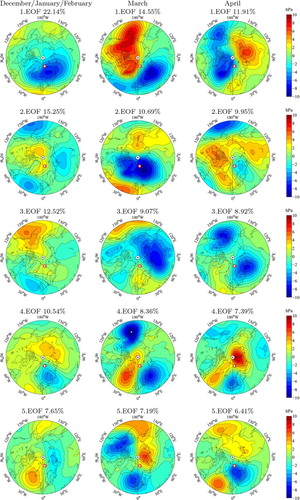
Table 2. Correlation coefficients and confidence range for the correlation between the principle components (PC) of the first five EOF MSLP DJF and the monthly mean τ 500nm of March and April in Ny-Ålesund (1995–2008)
Table 3. Correlation coefficients and confidence range for the correlation between the principle components (PC) of the first five EOF MSLP March and April and the daily mean τ 500nm of March and April in Ny-Ålesund (1995–2008)
Table 4. Correlation coefficients and confidence range between the measured τ 500nm/α in Ny-Ålesund, which were assigned a trajectory cluster, and the measured concentration of different atmospheric chemical components at Zeppelin
Table 5. Correlation coefficients and confidence range between the measured τ 500nm in Ny-Ålesund, which were assigned to a unique trajectory cluster, and the measured concentration of different atmospheric chemical components at Zeppelin
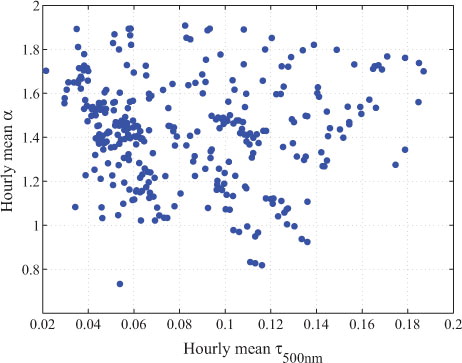
Fig. 11 Scatter plot of all hourly mean τ 500nm and α measured in Ny-Ålesund 1995–2008 and assigned to a trajectory cluster.