
Figures & data
Fig. 1 Map of the study area indicating the location of eddy covariance (EC) mast (Universal Transverse Mercator (UTM) zone 27, World Geodetic System (WGS) 84). White contour lines indicate 100 m elevation intervals. Inserted map shows the location of Zackenberg in Northeast Greenland (74.47°N, 20.55°W). The average footprint of the EC system was ca. 200 m long, directed towards southeast, and dominated by Cassiope heath plant community type (Lund et al., Citation2012).
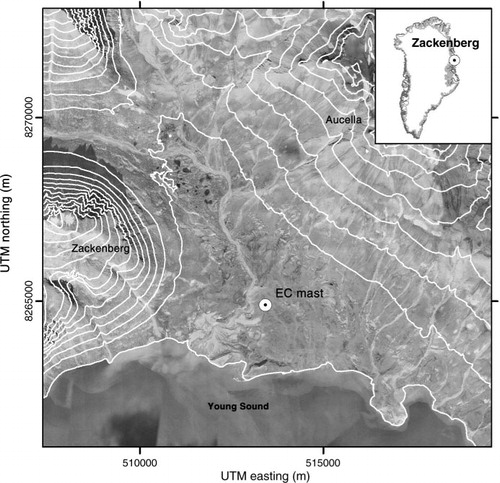
Fig. 2 Mean July air temperature (T a ) 1996–2010 (a) and maximum active layer depth (Max. ALD) 1997–2010 (b) in Zackenberg, NE Greenland.
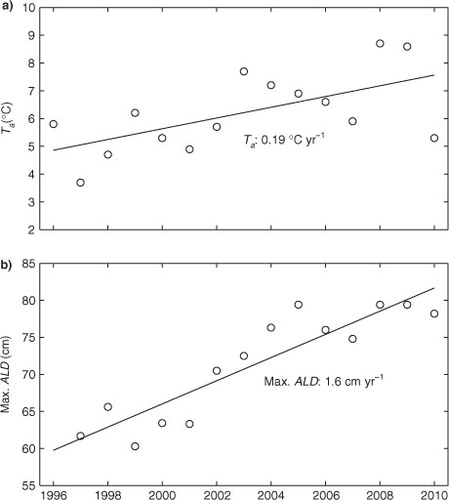
Table 1. Mid-summer period surface energy balance and environmental characteristics during the study period 2000–2010
Fig. 3 Environmental characteristics and surface energy dynamics during average year mid-summer period. (a) net radiation (Rn); (b) air temperature (Ta); (c) ratio of sensible heat (H) to Rn; (d) soil volumetric water content (θv); (e) ratio of latent heat (LE) to Rn; (f) surface resistance (rs); (g) ratio of ground heat flux (G) to Rn; (h) Priestley-Taylor α coefficient; (i) Bowen ratio (β); and (j) McNaughton & Jarvis Ω value. Black dots represent means and error bars standard error. Mid-summer period is defined as the period with daily average Ta and T 0 above 0°C, positive SWin and Rn, and albedo between 10 and 20%. Mean start and end dates during the study period (2000–2010) were 16 June and 1 September, respectively.
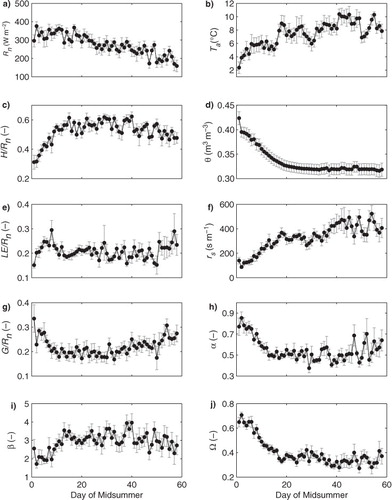
Fig. 4 Relationship between within-year variations in Bowen ratio (β) and environmental characteristics during 2003. (a) net radiation (Rn); (b) atmospheric vapour pressure deficit (Da); and (c) surface saturation vapour pressure deficit (Ds). Observations of β was averaged within bins of 50 W m−2 (Rn) and 100 Pa (Da, Ds), respectively. Black dots represent means and error bars standard deviation.
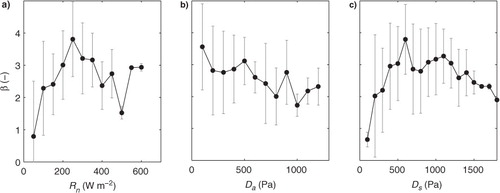
Fig. 5 Relationship between surface saturation vapour pressure deficit (Ds) and environmental characteristics during 2007. (a) McNaughton & Jarvis Ω value; (b) Priestley-Taylor α coefficient; and (c) surface resistance (rs). Observations of Ω, α and rs was averaged within Ds bins of 100 Pa. Black dots represent means and error bars standard deviation.
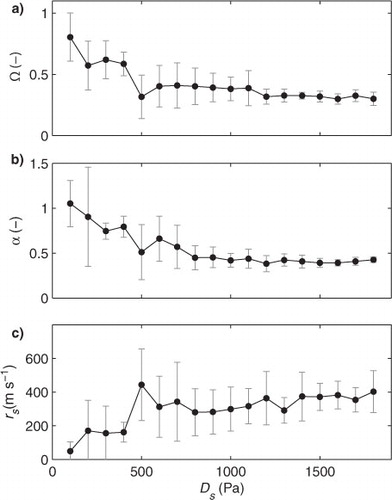
Table 2. Average midday, mid-summer meteorological conditions and surface energy partitioning characteristics during 2002 (means±standard deviation)
Fig. 6 Changes in mid-summer surface energy balance partitioning between 2000 and 2010. Lines indicate significant change in data. Error bars for G/Rn 2008–2010 indicates uncertainty (St. dev.) in extrapolating ɛ [eq. (4)]. 1-(H/Rn+LE/Rn) is a residual term in the energy balance serving as an independent proxy for G. Mid-summer period is defined as the period with daily average Ta and T 0 above 0°C, positive SWin and Rn, and albedo between 10 and 20%.
![Fig. 6 Changes in mid-summer surface energy balance partitioning between 2000 and 2010. Lines indicate significant change in data. Error bars for G/Rn 2008–2010 indicates uncertainty (St. dev.) in extrapolating ɛ [eq. (4)]. 1-(H/Rn+LE/Rn) is a residual term in the energy balance serving as an independent proxy for G. Mid-summer period is defined as the period with daily average Ta and T 0 above 0°C, positive SWin and Rn, and albedo between 10 and 20%.](/cms/asset/2087f719-3dbc-4e4d-8f4e-9a3a3c660231/zelb_a_11817266_f0006_ob.jpg)