Figures & data
Table 1. Campaign average values of f(RH =85%) for the different nephelometer wavelengths (: wavelength, STD: standard deviation, prctl: percentile)
Fig. 1 Scattering enhancement f(RH) at nm measured at Melpitz. (a)–(d) Selected humidograms for different air masses (both hydration and dehydration scans; green points). The parameterisation of the upper and lower branch (γ-fit) is described in the text. Small inlays show 72-hour back trajectories for the specific time periods shown above the panel. (e) Time series of f(RH) at
nm recalculated to RH=85% (1-hour mean value). Indicated are the times when the WetNeph was measuring in the constant RH mode (RH≈85%) or in the humidogram mode. Grey lines indicate the standard deviation (constant RH mode) or the 95% confidence interval (humidogram mode). The red marked points show the time periods for the humidograms shown in the upper panels. (f) Time series of the particle scattering coefficient σ
sp at
nm measured at dry conditions (DryNeph). (g)–(j) Mean surface size distribution (TDMPS and OPC) and mean submicron chemical mass fraction (AMS and MAAP) for the same periods as the upper panels.
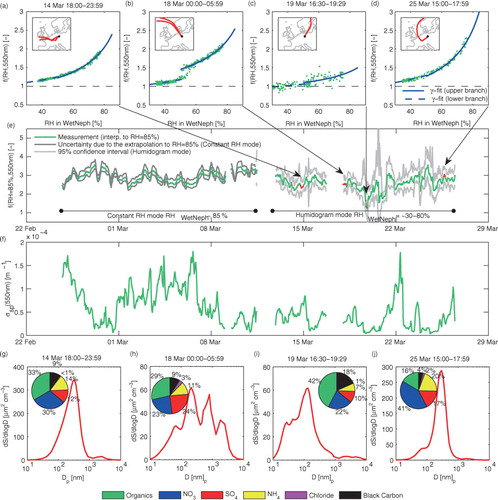
Fig. 2 Δf(RH=55%, 550 nm) of upper and lower branch vs. the sodium chloride mass fraction of the filter measurements. The error bars denote the standard deviation of the daily mean values and the solid black line represents a linear regression.
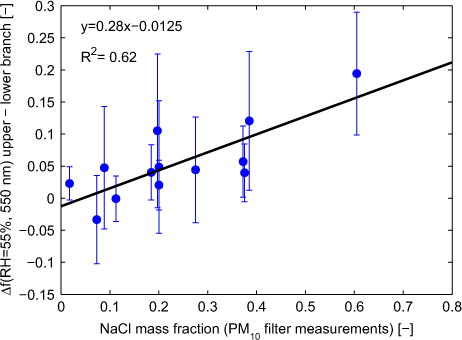
Fig. 3 FLEXTRA backward air trajectories (72 hours) for the entire measurement period colour-coded by different intensive aerosol parameters measured at the time the air parcel arrived at Melpitz, Germany (black dot): (a) Scattering enhancement f(RH=85%, 550 nm); (b) Inorganic mass fraction; (c) Mean particle surface area diameter. The inorganic mass fraction is determined from AMS and MAAP measurements and represents a value for refractory and submicron particles only (see text for details).
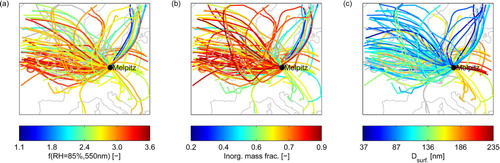
Fig. 4 Scattering enhancement f(RH=85%, 550 nm) vs. different aerosol mass fractions measured by the AMS (sensitive for non-refractory and submicron particles only) and MAAP: (a) Organic mass fraction; (b) Nitrate mass fraction; (c) Sulphate mass fraction; (d) Ammonium mass fraction; (e) Black carbon (BC) mass fraction; (f) Inorganic mass fraction. The solid black line denotes a bivariate linear regression including weights and calculated uncertainties of slope and intercept.
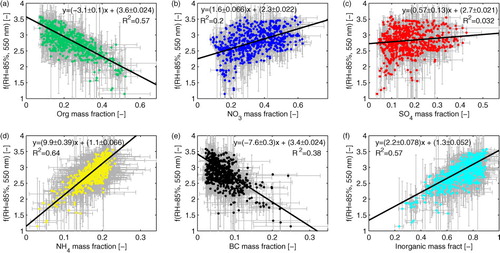
Fig. 5 Correlation plot of different aerosol parameters. f(RH=85%): scattering enhancement (at nm); spectral slope of f(RH=85%); σ
sp,dry: scattering coefficient (at
nm); α
sp,dry: Ångström exponent of dry particle light scattering coefficient; InOrgFrac: inorganic mass fraction; Org frac: organic mass fraction; NO3 frac: nitrate mass fraction; SO4 frac: sulphate mass fraction; NH4: ammonium mass fraction; BC frac: black carbon mass fraction; SCM/Stot: coarse mode surface area fraction; Stot: aerosol total surface area; g(265 nm): hygroscopic growth factor (from the H-TDMA) at the dry diameter of 265 nm. All mass fractions are determined from AMS and MAAP measurements (for non-refractory and submicron particles only).
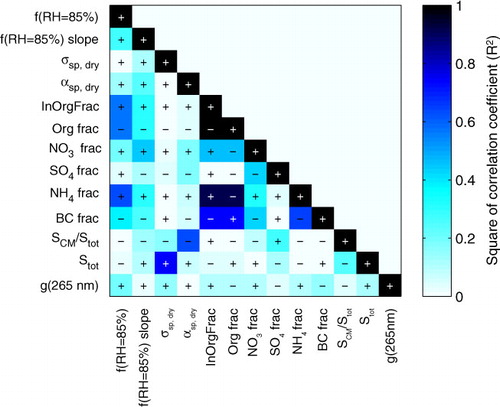
Fig. 6 (a) Predicted vs. measured scattering coefficient at dry conditions (at nm). The error bars give the standard deviation of the measurements (x-axis) and the uncertainty of the calculated scattering coefficient due to the uncertainty in the OPSS (see text). (b) Box plots of the percentile difference between predicted and measured value. The upper six box plots are for the f(RH=85%, 550 nm) for the different assumptions (see legend and text), the lower box gives the comparison for the dry scattering coefficient (OPSS not shifted, at
nm). The central red mark is the median, the edges of the box are the 25th and 75th percentiles, the error bars show the extent to the most extreme data points that are not considered as outliers, while the outliers are plotted individually (red crosses). The number of points is given on the right hand site (1-hour values). CM denotes the coarse mode which has been assumed to consist of sodium chloride (NaCl) or mineral dust.
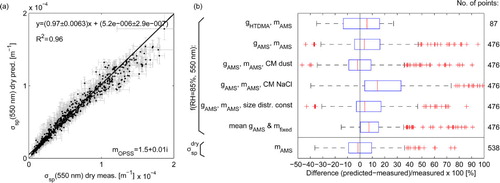
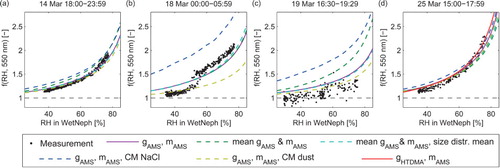
Fig. 7 (a)–(d) Measured and modelled f(RH) at nm for the example humidograms (see Figure 1) and the different model assumptions (see legend and text). CM denotes the coarse mode which has been assumed to consist of sodium chloride (NaCl) or mineral dust.