Figures & data
Fig. 1 Schematic illustration of simulating gross versus net land use change (LUC). Under a scheme for gross LUC (upper row), cropland is claimed from primary land (‘prim’) and abandoned to secondary land (‘secd’) in parallel within one grid cell. In the model, croplands and pasture areas undergo gross LUC in areas of shifting cultivation. Under a scheme for net LUC (lower row), only the difference of claimed minus abandoned undergoes a transition to use as cropland and no separate secondary land is formed. In the latter scheme, a smaller grid cell area fraction is affected by LUC.
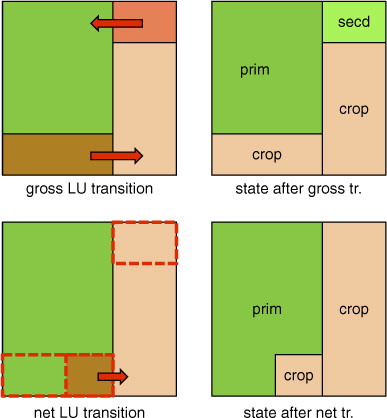
Table 1. Split of C and N mass into slash (on-site litter pools) and product pools of different turnover times (0 yr, 2 yr, 20 yr) after deforestation (in% of deforested and harvested tree biomass)
Table 2. Generated transitions priorities
Fig. 2 Historical annual LUC fluxes. Splined annual fluxes (thick colour lines) and year-by-year data for ‘gross, incl. wood harvest’ (thin grey line) are shown. The dashed lines (‘land turnover contribution’ and ‘wood harvest contribution’) are the differences between the respective curves (‘land turnover contribution’=‘gross, no wood harvest’ –‘net’; ‘wood harvest contribution’ =‘gross, incl. wood harvest’ –‘gross, no wood harvest’).
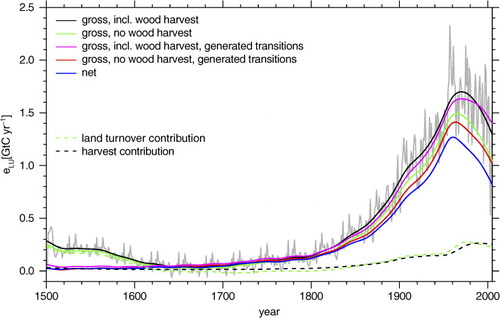
Table 3. Cumulative LUC emissions (E, [GtC]) and decadal average annual LUC fluxes (e, [GtC yr−1]
Fig. 3 Annual LUC fluxes by region (black curves) and their splined time series (red curve). The regions are illustrated by the map in the middle and correspond to the delineation used in IPCC AR5 (Ciais et al., Citation2013), except that ‘Eurasia’ is separated into Europe (everything west of 60°E), and Russia and the Former Soviet Union (FSU) (everything east of 60°E).
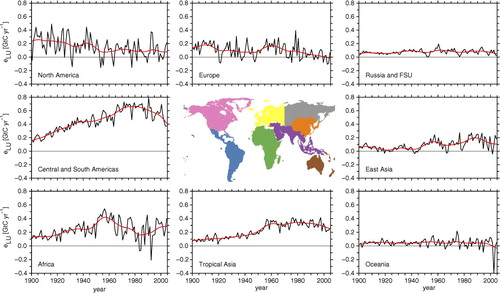
Fig. 4 Spatial distribution of cumulative historical (1850–2004) land use change (LUC) emissions and its components. (a) Total (gross, incl. wood harvest) cumulative LUC emissions in kgC/m2. (b) Cumulative emissions due to wood harvest. (c) Effect of land turnover (including the introduction of secondary land) as the difference between the run with gross land use (LU) transitions and a run with net LU transitions; both runs do not consider wood harvest. Note the different colour scales in the upper and the lower two panels.
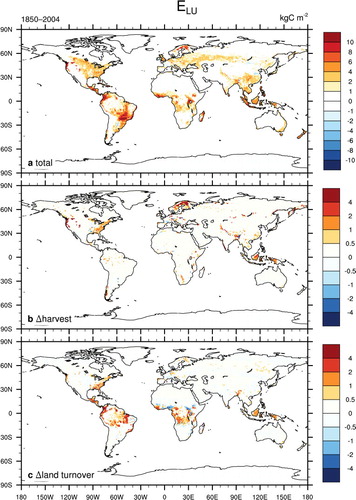
Fig. 5 Annual land use change (LUC) fluxes for 1900–2100 and the different RCPs. Thick black and coloured curves are splined time series of annual data, which is shown by the thin solid curve for the past. Dashed and dotted lines represent annual LUC fluxes, diagnosed from a simulation without wood harvesting and from a simulation where only net LUC is simulated, respectively.
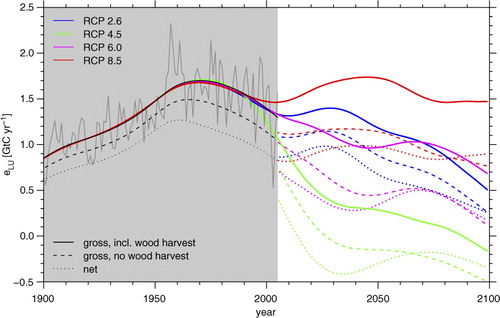
Fig. 6 Spatial distribution of cumulative future (RCPs) land use change (LUC) emissions and its components. Left: Total (gross, incl. wood harvest) cumulative LUC emissions in kgC/m2 middle: Cumulative emissions due to wood harvest. Right: Effect of land turnover (including the introduction of secondary land) as the difference between the run with gross land use (LU) transitions and a run with net LU transitions; both runs do not consider wood harvest. Note the different colour scales in the panels.
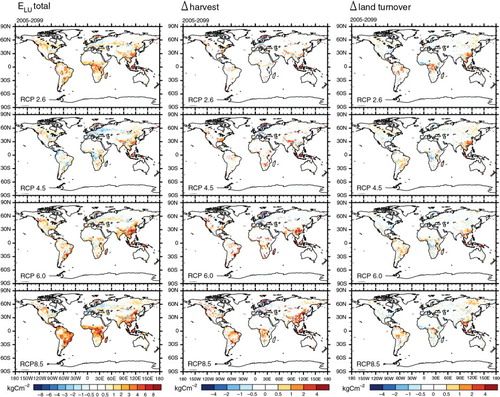
Table 4. Cumulative LUC emissions (E, [GtC]) for 2005–2099; combined effects from CO2 and climate; and individual effects from wood harvest, and land turnover (shifting cultivation)
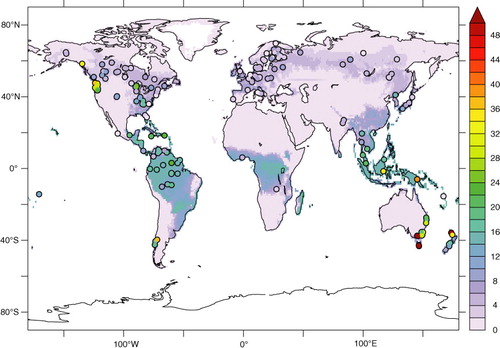
Fig. 7 Simulated (map) and observational (dots) vegetation carbon density (kgC/m2). The map represents total vegetation C density in the primary land use class at present day, diagnosed from a simulation without any anthropogenic LUC and wood harvest. Observational data are from Luyssaert et al. (Citation2007) and Keith et al. (Citation2009) and also represent primary forests.