
Figures & data
Fig. 1 Schematic setup for testing water vapour cross-sensitivity. Compressed sample gas is supplied to the LI-7200 IRGA after adjustment of the water vapour mole fraction with or without a dew point generator and then passing or not passing through a two-step dehumidification unit consisting of an electric cooler and a chemical trap. The ‘zero gas’ refers to sample gas with no CO2. See text for more details.
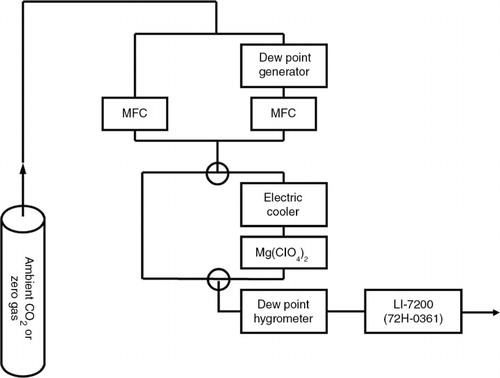
Fig. 2 Time-series example of the CO2 absorptances (upper) with H2O mole fractions (lower) in humidified (solid lines) and dehumidified (dotted lines) CO2 zero sample gas detected by the LI-7200 IRGA. The CO2 absorptance was corrected using the value of X wc supplied by the manufacturer. All data are plotted as 1-minute averaged values from 10 Hz raw data.
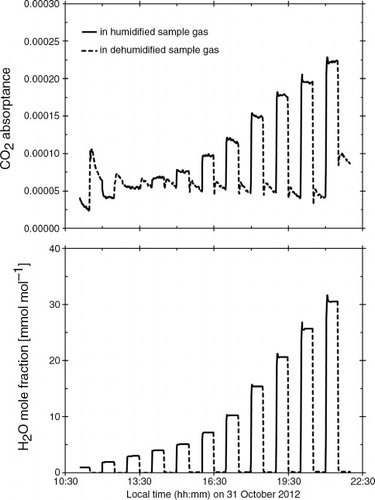
Fig. 3 Example of CO2 mixing ratio outputs in CO2 zero gas as a function of H2O mole fraction: dehumidified gas (□), humidified gas without the correction coefficient X wc (♦), humidified gas with X wc value supplied by the manufacturer (▪) and humidified gas with the X wc value adjusted in this study (×). This study adjusted the value of X wc such that the corrected CO2 outputs with X wc were almost the same as the CO2 outputs with dehumidified gas. Mixing ratio outputs were calculated as average values over a period of 3 minutes after the raw signals from the LI-7200 were stabilised.
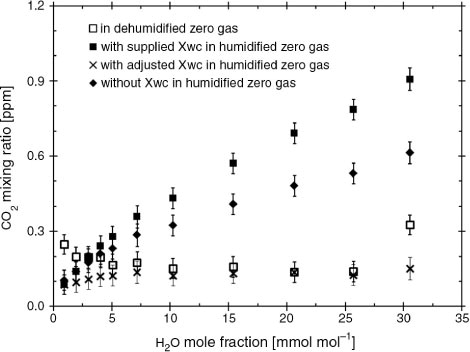
Fig. 4 Examples of effects of cross-sensitivity due to direct absorption interference as a function of H2O mole fraction, using single-path, dual-wavelength IRGAs listed in . The CO2 mixing ratios of all IRGAs calculated without any correction show several biases, with the assumption that the constant CO2 mixing ratio (400 ppm) is calculated for the changes of H2O mole fractions when all IRGAs are corrected by their individual values of X wc .
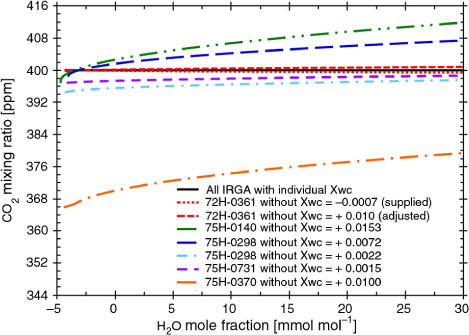
Table 1. Correction coefficients for cross-sensitivity due to direct absorption of CO2 due to H2O (X wc ) and zero factors and span adjustment terms for CO2 (Z c and S c ) and H2O (Z w and S w ) for the listed IRGAs in
Fig. 5 Example of CO2 mixing ratio outputs in ambient (403.7 ppm) CO2 gas as a function of H2O mole fraction: dehumidified gas (□), humidified gas with the manufacturer's values of a w (1.15) and X wc (−0.0007) (▪), humidified gas with the manufacturer's a w and adjusted X wc (0.001) values (♦), and humidified gas with adjusted values of X wc and a w from this study (×). The adjusted value of a w (1.78) was determined so that the CO2 output in humidified gas was almost the same as the CO2 output with dehumidified gas. The adjusted value of X wc was determined in Section 3.1.
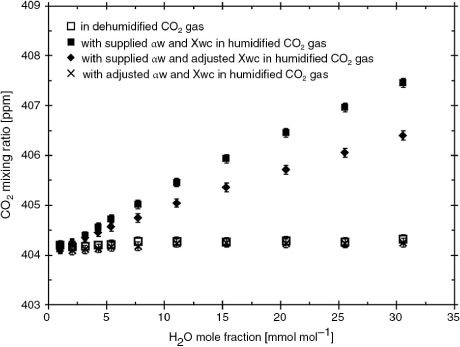
Fig. 6 Two examples of CO2 mixing ratios in dehumidified ambient CO2 gas (□) and in humidified ambient CO2 gas with adjusted values of X wc (0.001) and a w (1.78) (•), as functions of H2O. Different conditions of sea salt attachment on optical windows were applied, although the AGC values were equivalent (68.75) and remained constant during both tests.
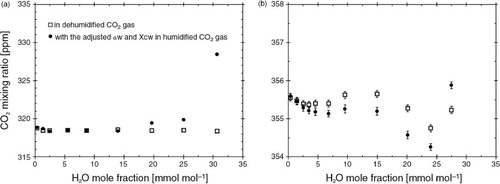
Fig. 7 Sensitivity tests of CO2 mixing ratio outputs in dry [□, rc(dry)] and humidified [•, rc(humid)] standard gases with known CO2 mixing ratios (359.7, 401.0 and 421.3 ppm CO2) under the condition of optical window contamination shown in b. The outputs in humidified gases were corrected with the adjusted values of X wc and a w , and were humidified at the highest level (~3.0%) during the test.
![Fig. 7 Sensitivity tests of CO2 mixing ratio outputs in dry [□, rc(dry)] and humidified [•, rc(humid)] standard gases with known CO2 mixing ratios (359.7, 401.0 and 421.3 ppm CO2) under the condition of optical window contamination shown in Fig. 6b. The outputs in humidified gases were corrected with the adjusted values of X wc and a w , and were humidified at the highest level (~3.0%) during the test.](/cms/asset/29e9a47b-dd23-4a8b-b1a6-bd7aa29f979c/zelb_a_11817257_f0007_ob.jpg)