Figures & data
Fig. 1 Across-corridor (i.e. the shipping corridors used in Peters et al. Citation2011) shipping emission profiles as implemented in simulation Bsc. Left panel: Annual mean ship-emission fluxes (log10 scale), cf. in Peters et al. (Citation2011); right panel: Share of the sulphur (S) emissions from ships in the total simulated S emission fluxes in [%] . Shipping emissions are averaged to the T63 model resolution prior to calculating across-corridor profiles.
![Fig. 1 Across-corridor (i.e. the shipping corridors used in Peters et al. Citation2011) shipping emission profiles as implemented in simulation Bsc. Left panel: Annual mean ship-emission fluxes (log10 scale), cf. Fig. 2 in Peters et al. (Citation2011); right panel: Share of the sulphur (S) emissions from ships in the total simulated S emission fluxes in [%] . Shipping emissions are averaged to the T63 model resolution prior to calculating across-corridor profiles.](/cms/asset/c5264bf0-46f9-4784-8180-1ea28a35d195/zelb_a_11817278_f0001_ob.jpg)
Fig. 2. Across-corridor profiles, taken over the red lines shown in , of selected model diagnostics for the mid-Atlantic shipping corridor, absolute and relative values are shown: sulphate burden integrated over the lower troposphere (a, e), AOD (b, f), CCN (0.2%) burden integrated over the lower troposphere (c, g), cloud droplet effective radius r
eff at cloud top (d, h), cloud droplet number concentration (CDNC) at cloud top (i, m), cloud water path (j, n), cloud optical depth (k, o) and cloud fraction (maximum overlap assumed) (l, p). The error bars denote the confidence in the calculated mean value toward higher/lower values as given by and
, where e
l
and e
u
are the lower and upper bounds,
the mean value, l
i
and u
i
the samples smaller and larger than the mean and N
l
and N
u
the number of samples smaller and large than the mean, respectively. Relative changes are
.
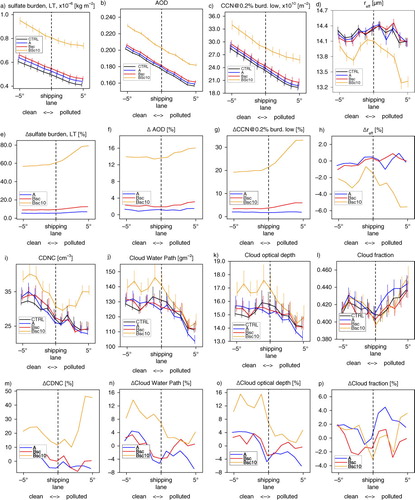
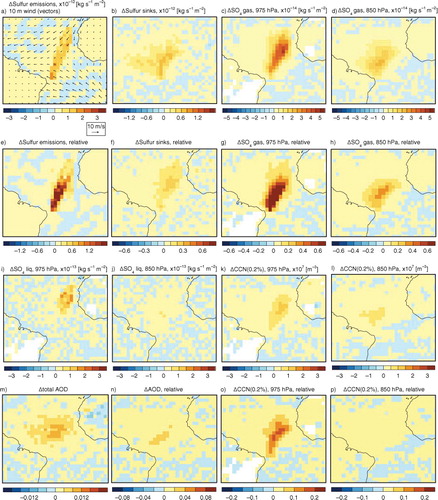
Fig. 3 Ship-emission (simulation Bsc) induced 5-yr annual mean absolute and relative changes of sulphur emissions and sinks (a, e and b, f, respectively), sulphate production from gas phase chemistry at 975 and 850 hPa (c, g and d, h, respectively), sulphate production from aqueous oxidation at 975 and 850 hPa (i and j, absolute changes only), total AOD (m, n), CCN concentrations at 0.2% supersaturation at 975 and 850 hPa (k, o and l, p, respectively). Relative changes are derived after . Vectors in (a) indicate the 5-yr mean 10 m wind direction and speed. The black line in (a) shows the assumed location of the windward edge of the shipping lane. The red lines in all panels indicate the part of the shipping lane used to create .
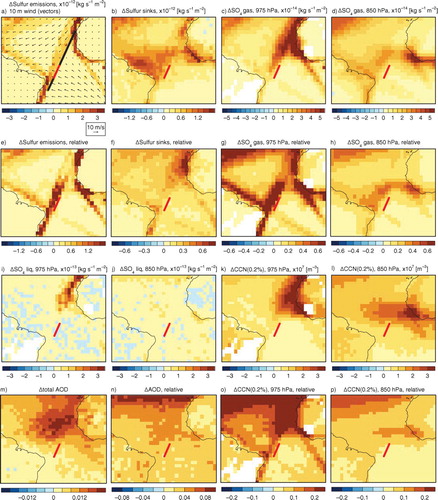
Fig. 4 As , but for simulation Bsc_mAt.