Figures & data
Fig. 1 Distributions of land cover and land use types in China in (a) the late 1980s and (b) the mid-2000s. The regions of China examined in this study are also shown, including northeastern (NE, 35.00°–53.00°N, 108.75°–136.25°E), southeastern (SE, 17.00°–35.00°N, 108.75°–123.75°E), northwestern (NW, 35.00°–49.00°N, 73.75°–108.75°E), southwestern (SW, 21.00°–35.00°N, 96.25°–108.75°E), and plateau (PT, 27.00°–35.00°N, 76.25°–96.25°E) regions.
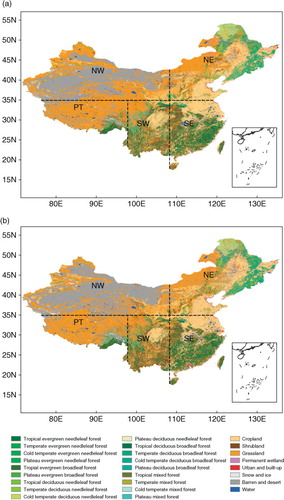
Table 1. Isoprene and monoterpene emission factors and specific leaf weight (SLW) used in this study
Table 2. Summary of the simulations in this study
Fig. 2 The changes in fractions of each 1°×1° grid cell covered by (a) forests, (b) shrubs, (c) grass, and (d) crops from the late 1980s to the mid-2000s.
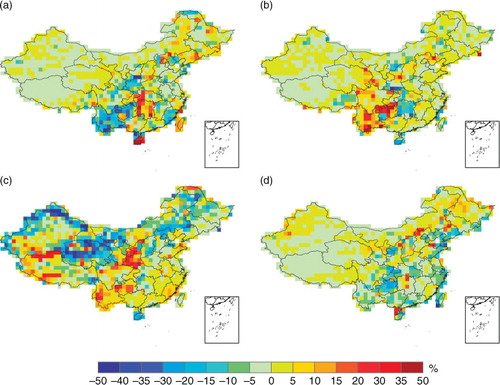
Table 3. Simulated BVOC emissions in the late 1980s and the absolute and percentage changes in BVOCs from the late 1980s to the mid-2000s owing to changes in both land use and meteorological conditions (referred to as combined effect), changes in land cover and land use alone (referred to as LCLU effect), and changes in meteorological parameters alone (referred to as Met effect)
Fig. 3 Simulated seasonal mean changes from the late 1980s to the mid-2000s as a result of changes in both land cover and meteorological parameters (CTRL_2000s minus CTRL_1980s): (a) isoprene emissions (unit: 106 kg C month−1), (b) monoterpene emissions (unit: 106 kg C month−1), (c) surface-layer O3 (unit: ppbv), and (d) SOA concentrations (unit: µg m−3).
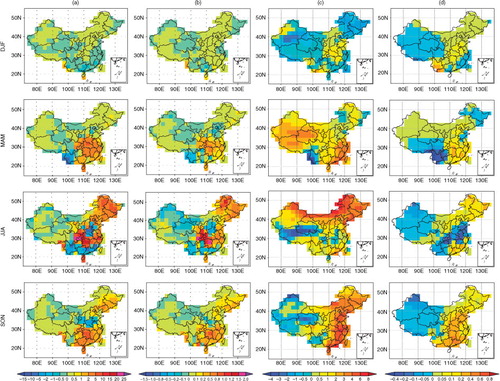
Fig. 4 Simulated seasonal mean changes from the late 1980s to the mid-2000s as a result of the changes in land cover alone (SENS_LCLU minus CTRL_1980s): (a) isoprene emissions (unit: 106 kg C month−1), (b) monoterpene emissions (unit: 106 kg C month−1), (c) surface-layer O3 (unit: ppbv), and (d) SOA concentrations (unit: µg m−3). Note that the magnitudes of changes in O3 and SOA are different from those in Fig. 3.
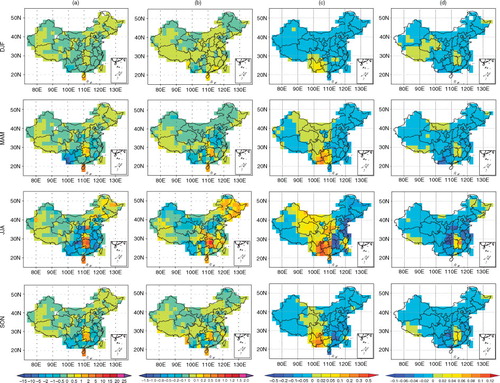
Fig. 5 Simulated seasonal mean changes from the late 1980s to the mid-2000s a result of changes in meteorological parameters alone (SENS_MET minus CTRL_1980s): (a) isoprene emissions (unit: 106 kg C month−1), (b) monoterpene emissions (unit: 106 kg C month−1), (c) surface-layer O3 (unit: ppbv), and (d) SOA concentrations (unit: µg m−3).
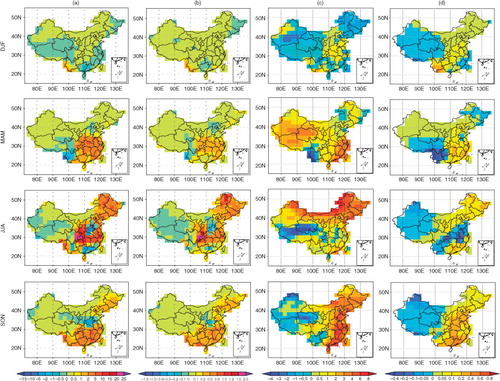
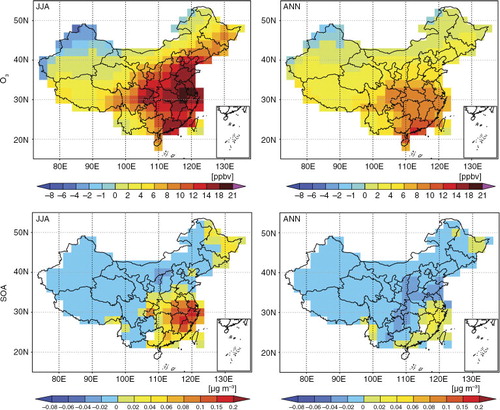
Fig. 6 Simulated changes in summer (JJA) and annual mean surface-layer concentrations of O3 and SOA as a result of changes in anthropogenic emissions over 1985–2005 (CTRL_2000s minus SENS_ANTH). Unit is ppbv for O3 and µg m−3 for SOA.